6.1/6.2 Sampling Dist.
6.3: Sample Count
6.4: Sample Proportion
6.5/6.6: Samp. Mean / CLT
Misc.
100
What is the difference between a parameter and a statistic?
A parameter describes a population whereas a statistic describes a sample.
100
What are the formulas to find the mean and standard deviation of the sampling distribution of a sample count?
What is 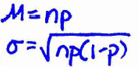
100
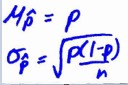
What are the formulas to find the mean and standard deviation of the sampling distribution of a sample proportion?
100
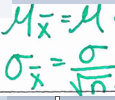
What are the formulas to find the mean and standard deviation of the sampling distribution of a sample mean?
100
On a New York-Denver flight, 8% of the 125 passengers were selected for random security screening before boarding. According to the Transportation Security Administration, 10% of passengers at this airport are supposed to be chosen for random screening.
What is the sample?
the 125 passengers
200
Identify the population, parameter, sample and statistic in the following setting:
On Tuesday, the bottles of iced tea filled in a plant were supposed to contain an average of 20 ounces of iced tea. Quality-control inspectors sampled 50 bottles at random from the day’s production. These bottles contained an average of 19.6 ounces of iced tea.
Population: All bottles of iced tea filled in a plant.
Parameter: 20 ounces
Sample: 50 bottles
Statistics: 19.6 ounces
200
Eleven percent of students at a large high school are left-handed. A statistics teacher selects a random sample of 100 students and records X = the number of left-handed students in the sample.
Calculate the mean and standard deviation of the sampling distribution of X.
mean = 11 Standard Deviation = 3.13
200
The makers of M&M's claim that 18% of M&M's candies are blue. You select a random sample of 70 M&M's from a large bag. Let p = the proportion of blue M&M's in the sample.
Calculate the mean and the standard deviation of the sampling distribution of p hat.
mean = .18 Standard deviation = 0.046
200
A local garden center says that a certain variety of tomato plant produces tomatoes with a mean weight of 250 grams and a standard deviation of 42 grams. You take a random sample of 20 tomatoes produced by these plants and calculate their mean weight .
Calculate the mean and standard deviation of the sampling distribution of x bar.
mean = 250 grams standard deviation = 9.39
200
In the game of Scrabble, each player begins by drawing 7 tiles from a bag containing 100 tiles. There are 42 vowels, 56 consonants, and 2 blank tiles in the bag. Cait chooses an SRS of 7 tiles.
What would be sample proportion in this scenario?
0.42
300
List all 10 possible SRSs of size n = 2 for the following 5 test scores:
80, 87, 95, 97, 99
(80 and 87) (80 and 95) (80 and 97) (80 and 99)
(87 and 95) (87 and 97) (87 and 99)
(95 and 97) (95 and 99)
(97 and 99)
300
Dysplasia is a malformation of the hip socket that is very common in certain dog breeds and causes arthritis as a dog gets older. According to the Orthopedic Foundation for Animals, 11.6% of all Labrador retrievers have hip dysplasia. A veterinarian tests a random sample of 50 Labrador retrievers and records Y = the number of Labs with dysplasia in the sample.
Suppose the mean and standard deviation of the sampling distribution of Y were 5.8 and 2.26 respectively.
Interpret the standard deviation.
The number of Labs with dysplasia in the sample typically varies from the mean of 5.8 by 2.26
300
According to a recent U.S. Bureau of Labor Statistics report, the proportion of married couples with children in which both parents work outside the home is 59%. You select an SRS of 50 married couples with children and let p = the sample proportion of couples in which both parents work outside the home.
Suppose the mean and standard deviation of the sampling distribution of p hat were 0.59 and 0.07 respectfully.
Interpret the standard deviation.
The sample proportion of couples in which both parents work outside the home typically varies from the mean of 0.59 by 0.07.
300
A local garden center says that a certain variety of tomato plant produces tomatoes with a mean weight of 230 grams and a standard deviation of 38 grams. You take a random sample of 30 tomatoes produced by these plants and calculate their mean weight .
Suppose the mean and standard deviation of the sampling distribution of x bar were 230 and 6.94 respectively.
Interpret the standard deviation
The mean weight of the tomatoes typically varies from the mean of 230 by 6.94
300
A statistic is an unbiased estimator of a parameter when
a. the statistic is calculated from a random sample.
b. in all possible samples of a specific size, the distribution of the statistic has a shape that is approximately normal.
c. in all possible samples of a specific size, the values of the statistic are very close to the value of the parameter.
d. in all possible samples of a specific size, the values of the statistic are centered at the value of the parameter.
d. in all possible samples of a specific size, the values of the statistic are centered at the value of the parameter.
400
When you decrease the sample size, what happens to the variability of the sampling distribution?
The variability increases.
400
Eleven percent of students at a large high school are left-handed. A statistics teacher selects a random sample of 100 students and records X = the number of left-handed students in the sample.
Would it be appropriate to use a normal distribution to model the sampling distribution of X = the number of left-handed students in the sample? Justify your answer.
Yes, because np and n(1-p) are both greater than or equal to 10.
400
A large mail-order company advertises that it ships 90% of its orders within 3 working days. You select an SRS of 100 of the orders received in the past week for an audit. Let p hat = the proportion of orders in the last week that were shipped within 3 working days.
Would it be appropriate to use a normal distribution to model the sampling distribution of p hat = the proportion of orders in the last week that were shipped within 3 working days? Justify your answer.
Yes, because np and n(1-p) are both greater than or equal to 10.
400
Driving styles differ, so there is variability in the fuel efficiency of the same model automobile driven by different people. For a certain car model, the mean fuel efficiency is 23.6 miles per gallon with a standard deviation of 2.5 miles per gallon. Suppose we took a simple random sample of 25 owners of this model and calculate the sample mean fuel efficiency of x bar.
Would it be appropriate to use a normal distribution to model the sampling distribution of x bar?
No, because our sample is less than 30 and by the CLT our sample has to be large in order to model using a normal distribution.
400
The central limit theorem is important in statistics because it allows us to use the normal distribution to find probabilities involving the sample mean if the
a. sample size is reasonably large for any population shape.
b. sample size is reasonably large and the population is normally distributed.
c. population size is reasonably large for any population shape.
d. population size is reasonably large and the population is normally distributed.
a. sample size is reasonably large for any population shape.
500
A polling organization wants to estimate the proportion of voters who favor a new law banning smoking in public buildings. The organization decides to increase the size of its random sample of voters from about 1500 people to about 4000 people right before an election. The effect of this increase is to
Reduce the variability of the estimate.
500
Lefties Eleven percent of students at a large high school are left-handed. A statistics teacher selects a random sample of 100 students and records X = the number of left-handed students in the sample.
Calculate the probability that at least 15 of the members of the sample are left-handed.
.1003
500
Harley-Davidson motorcycles make up 14% of all the motorcycles registered in the United States. You plan to interview an SRS of 500 motorcycle owners. Find the probability that 20% or more of the motorcycle owners in the sample own Harleys.
0%
500
The amount that households pay service providers for access to the Internet varies quite a bit, but the mean monthly fee is $48 and the standard deviation is $20. The distribution is not normal: Many households pay a base rate for low-speed access, but some pay much more for faster connections. A sample survey asks an SRS of 500 households with Internet access how much they pay per month. Let x bar be the mean amount paid by the members of the sample.
Find the probability that the average amount paid by the sample of households exceeds $50.
0.0122
500
A machine is designed to fill 16-ounce bottles of shampoo. When the machine is working properly, the amount poured into the bottles follows a normal distribution with mean 16.05 ounces and standard deviation 0.1 ounce. Assume that the machine is working properly. If 4 bottles are randomly selected and the number of ounces in each bottle is measured, then there is about a 95% chance that the sample mean will fall in which of the following intervals?
(a) 16.00 to 16.10 ounces
(b) 15.95 to 16.15 ounces
(c) 15.90 to 16.20 ounces
(d) 15.85 to 16.25 ounces
(b) 15.95 to 16.15 ounces