Correlations
Line of Best Fit
Two - Way Tables
Line of Fit Equations
Outliers
100
Name the correlation for this graph:
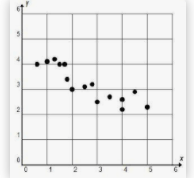
What is negative correlation?
100
A line of fit should be in this relation to the data points.
What is through the middle
100
Total number of students that made Honor Roll
What is 68?
100
Two points on the line of best fit are (4, 85) and (2, 70). Find the slope for the line of best fit using these points.
What is 15/2 or 7.5?
100
A data point that is far from the line of best fit.
What is an outlier?
200
In general, the more one eats the less hunger they feel. Identify the type of correlation.
What is negative?
200
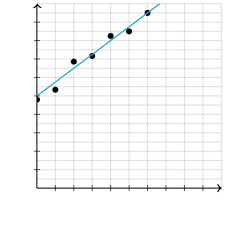
Write the equation for the line of fit shown.
y = 1/2 x + 2
200
Total number of students that did not make Honor Roll

What is 63?
200
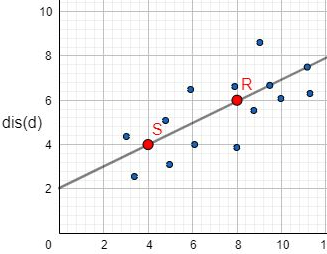
Slope of line of best fit (each space is 1.)
What is 3/2 or 1.5?
200
A series of data point bunched together on a scatter plot.
What is a cluster?
300
This describes the correlation between time running on a treadmill and calories burned.
What is positive?
300
Which line is the best model of the data?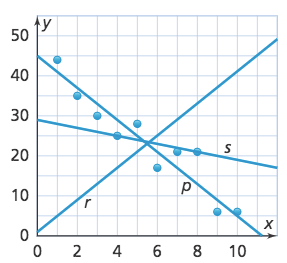
What is Line "P"?
300
Total students surveyed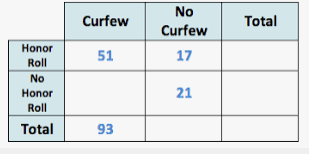
131
300
The equation for the line of best fit for this graph:
y=3/2x + 10
300
Do you include an outlier when making the line of best fit?
No.
400
Name the correlation for this graph:
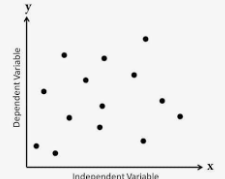
What is no correlation?
400
A scatter plot was made to show the number of cars in a city. The equation was y = 12x +300 where x is the number of years since 2000 and y is the number of cars. What year was there 444 cars?
2012
400
Total number of students that have No Curfew?

What is 38?
400
The equation of the line of best fit for a scatter plot is y=12x - 216, where x represents the temperature outside and y represents the sales of the ice cream shop. Predict the temperature outside if the ice cream shop had a total sales of $700.
What is about 76 degrees?
400
The data point that is an outlier
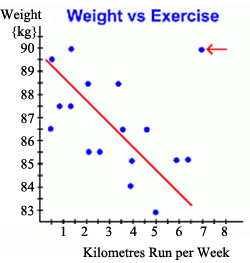
What is (7, 90)
500
As temperature decreases, the speed at which molecules move decreases. Identify the type of correlation.
What is Positive?
500
Using line of best fit, predict what y would equal if x was 4.
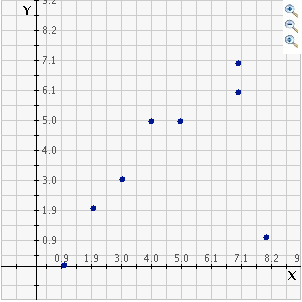
4
500
Of the people with a car, what is the relative frequency of those with no laptop?
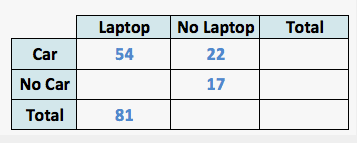
22/76
500
Find the equation of the line of best fit
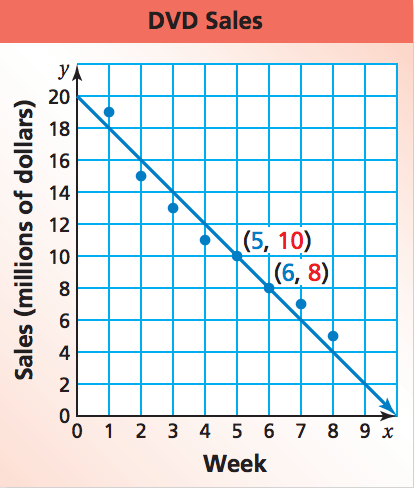
y=-2x+20
500
A scatter plot was made to show the number of cars in a city. The equation was y = 12x +300 where x is the number of years since 2000 and y is the number of cars. How many cars were there in 2024?
588