7.1 Central Measures of Tendency
7.2 Box and Whisker Plots
7.3 Shapes of Distribution
7.4 Two-Way Tables
Extra Math!
Non-Math
100
What is the outlier?
88, 92, 85, 58, 88, 92, 85, 90
The outlier is 58.
100
What is a 5 Number Summary?
Minimum
Q1 (Lower Quartile)
Median
Q3 (Upper Quartile)
Maximum
100
What are the three main shapes of data distributions?
Symmetric
Skewed Left
Skewed Right
100
What are marginal frequencies?
The total of all the rows and columns.
100
What are supplementary angles?
Two angles that add up to 180 degrees.
100
This crunchy, salty snack comes in orange dust form and will betray your keyboard and whiteboard markers.
Cheetos
200
What is the median of the following?
3, 10, 7, 12, 7
Median is 7.
200
A box plot shows the following:
Min = 10, Q1 = 15, Median = 20, Q3 = 25, Max = 35
What is the range?
Range= 25
200
A histogram has a tall center and the bars taper off equally on both sides.
What is the shape of the distribution?
Symmetric
200
If 75 males were surveyed and 18 didn’t have a summer job, how many did?
57
200
Write the equation of a line with slope –2 and y-intercept 7.
y= -2x + 7
200
This item somehow ends up on the floor no matter how many times it’s picked up.
A pencil
300
What is the mean of the following? (Round to the nearest tenth, one decimal place)
-2, 5, 0, -1, 4, 3, 2
Mean is 1.6.
300
Out of the 5 Number Summary, what is makes up 50% of the data?
The Q1 to Q3 makes 50% of the data.
300
If a data distribution is skewed right, which measure of center is most appropriate to describe it: mean or median?
Median, because the mean is pulled up by larger values on the right.
300
If there are 135 total students, 70 are juniors, and 76 don’t ride the bus, how many do ride the bus?
59
300
Find y at x= -2:
y= 4(x-3) + 10
y= -10
300
When a teacher says “I’ll wait,” they actually mean this.
“You better stop talking or I will laser-beam you with my eyes”?
400
Find the mode of the following:
88, 92, 85, 88, 92, 85, 90
The modes are 85, 88, and 92 (each of these numbers appear twice.
400
A box plot shows the following:
Min = 10, Q1 = 15, Median = 20, Q3 = 25, Max = 35
What is the interquartile range (IQR)?
IQR= 10
400
If a data distribution is skewed left, which measure of variation is most appropriate to describe it:
Standard Deviation or 5 Number Summary (IQR)
5 Number Summary (IQR)
400
How many total females are there?
217
400
Solve for x:
3(x−2)=2x+5
x=11
500
What is the standard deviation of the following?
*Round to the nearest tenth.
12, 3, 18, 7, 25, 10, 6, 15, 20
The standard deviation is 6.8.
500
Use the data set: 12, 15, 18, 20, 22, 25, 30, 33, 36
Find the 5-number summary.
Min = 12
Q1 = 18
Median = 22
Q3 = 30
Max = 36
500
If a data distribution is symmetric, which measure of center and variation is most appropriate to describe it:
Center: Mean or Median (pick one)
Variation: Standard Deviation or 5 Number Summary (IQR) (pick one)
Center: Mean
Variation: Standard Deviation
500
Fill out the missing values for the table:
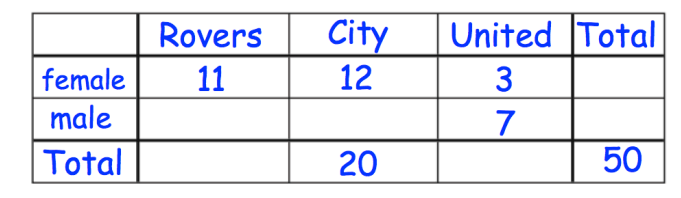
Male Rovers: 9
Male City: 8
Total Rovers: 20
Total United: 10
Total Female: 26
Total Male: 24
500
What’s the perimeter of a square with area 49?
Perimeter= 28