Ch. 5
Ch. 5
Ch. 6
Ch. 6
100
What is the formula for probability?
p(x) = f(x) / sample space
100
Define random event, fixed event, and sample space.
random event - any event in which the outcome observed can vary
sample space - the total # of possible outcomes that can occur in a given random event
100
What is a sampling distribution?
A distribution of the mean and variance for all possible samples of a given size from a population.
100
A researcher uses a sample ________ to make inferences about the value of a population ________ of interest.
A researcher uses a sample statistic to make inferences about the value of a population parameter of interest.
200
Compute the simple probability.
There are 8 men and 12 women entered in a raffle, what is the probability of selecting a woman?
hint: p(x) = f(x) / sample space
f(x) = 12
sample space= 12 + 8 = 20
12/20 = 0.6 = 60% chance of selecting a woman
200
In the Unit Normal Table:
Column A lists ______.
Column B lists ______.
Column C lists ______.
Column A lists the z scores.
Column B lists the area between a z score and the mean.
Column C lists the area from a z score toward the tail.
200
Explain sampling without replacement and sampling with replacement.
Which is a theoretical sampling strategy or an experimental sampling strategy?
Without: a method of sampling in which each participant or item selected is not replaced before the next selection.
With: a method of sampling in which each individual or item is replaced after each selection.
200
How is the standard error of the mean (SEM) reported in APA format?
Text, in a table, or in a graph.
When data are reported in the text or in a table, they are usually reported with the value of the mean. In a graph, the standard error is displayed as a vertical bar extending above and below each mean plot or mean bar.
300
1. __% of data falls within __ SD of the mean.
2. These data are _________ (normal/likely, not normal/unlikely).
1. 95% of data falls within 2 SD of the mean.
2. These data are normal/likely.
300
What is the z score given p = .2033?
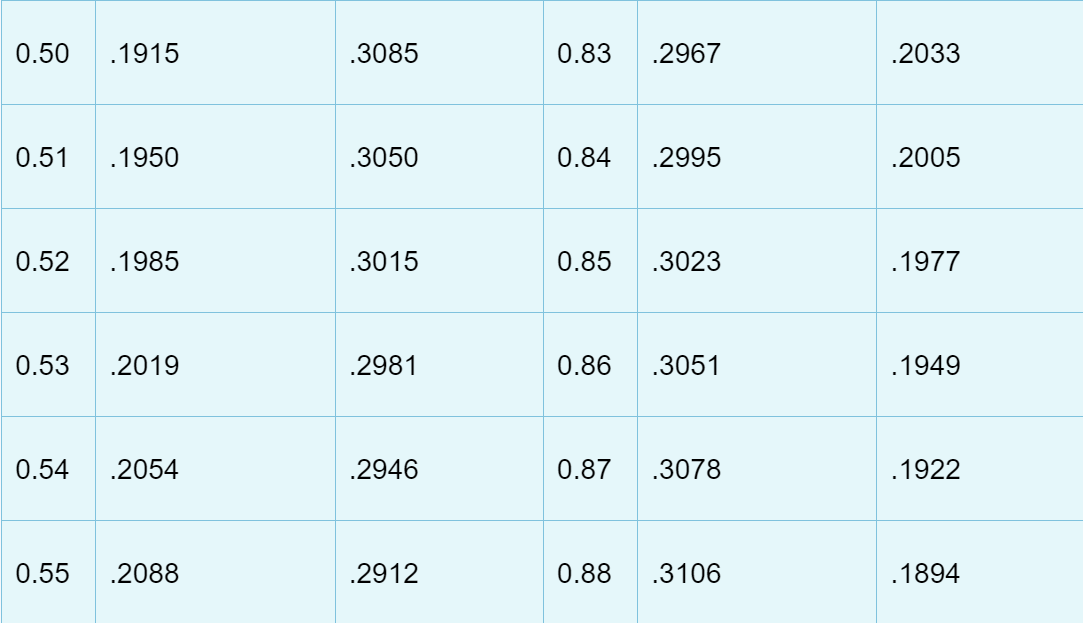
z = 0.83
300
What are the steps for computing SEM in SPSS?
Analyze --> Descriptive Statistics --> and Descriptives
A dialog box will pop up --> tab over your variable --> select Options --> choose "S.E. mean" option to compute an estimate of the standard error
300
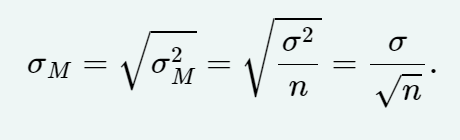
What is SEM? What is the formula?
The standard error of the mean (SEM or standard error SE) is the standard deviation of the sampling distribution of sample means. It tells us how far the possible sample means deviate from the value of the population mean.
400
What is the z-score formula for a sample? Calculate it using the information provided.
M = 36
SD = 2
x = 40
z = x - M / SD
= (40 - 36) / 2
= (4) / 2
z = 2.00
400
What are the 8 characteristics of the normal distribution?
*you can choose a friend to help!*
1. The normal distr. is mathematically defined.
2. The normal distribution is theoretical.
3. The mean, median, & mode are all located at the 50th percentile.
4. The normal distr. is symmetrical.
5. The mean can equal any value.
6. The standard deviation can equal any positive value.
7. The total area under the curve of a normal distr. is equal to 1.0.
8. The tails of a normal distr. are asymptotic.
400
What is the formula for the variance of a sampling distribution?
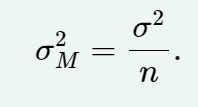
It is the population variance divided by the sample size.
400
What are the steps in locating the proportion of area (probabilities) of sample means in any sampling distribution?
The same as before! Just different notation.
1. Transform a sample mean (M) into a z score.
2. Locate the corresponding proportion for the z score in the unit normal table.
500
The unit normal table, or z table, only lists positive z scores. Why not negative z scores?
The normal distribution is symmetrical, meaning that values below the mean are the same as those above the mean.
500
A sample of scores is normally distributed with M = 8 and SD = 2.
What is the probability of obtaining a score greater than 12? (remember there are steps to this)
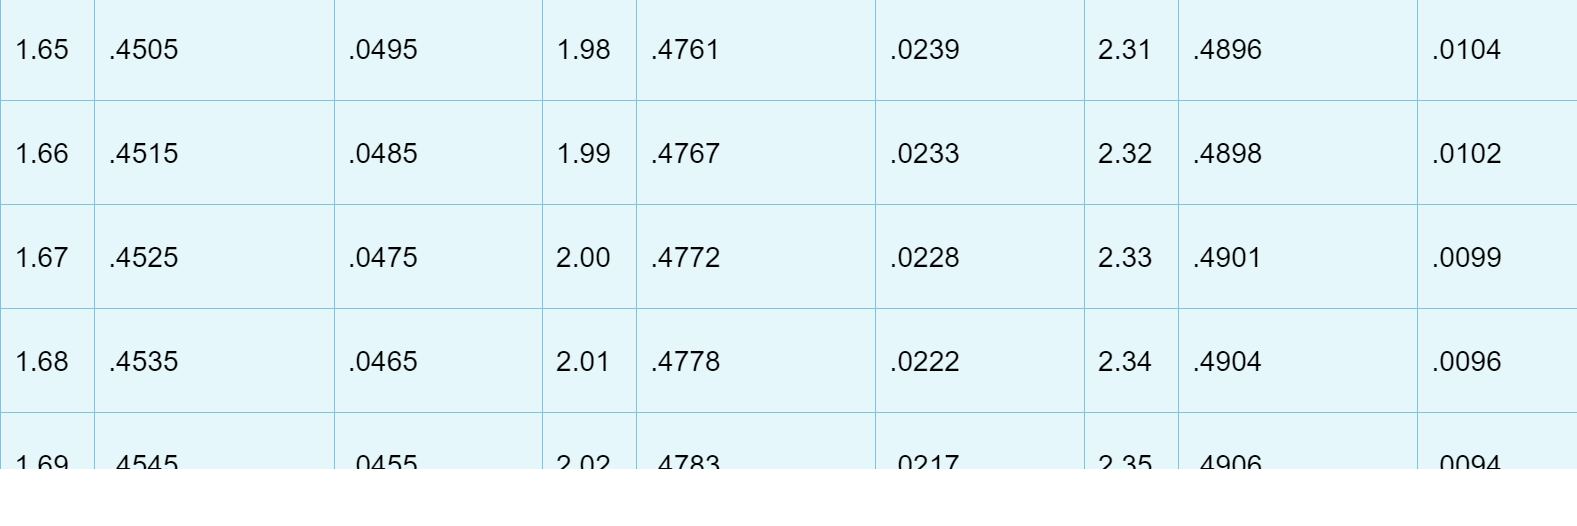
Step 1: Transform raw score into z score.
(12 - 8) / 2
z = 2.00
p = .0228
500
What is the relationship between standard error, standard deviation, and sample size?
As the population standard deviation (σ) increases, standard error increases.
As the sample size (n) increases, standard error decreases. The more data you collect, the closer your estimate of the value of the population mean.
500
What are the 3 characteristics of the sampling distribution of the sample mean?
1. Unbiased Estimator: The sample mean we obtain in a randomly selected sample will, on average, = the population mean.
2. Central Limit Theorem: The distr. of sample means selected at random from the population will approach the shape of a normal distribution as the # of samples increase.
3. Minimum Variance: The sampling distr. of the mean will vary minimally from the value of population mean.