Data Collection Plan
Value Add Analysis
3 Step Dance
Process Mapping
Random!
100
This type of data are counts, binary, attributes nominal or ordinal.
What is Discrete Data?
100
How do we know what the customer values?
What is Voice of the Customer.
100
What is a measurement error from one person taking repeated measures of the same part, with the same measurement tool?
What is Repeatability?
100
This Process Map is called?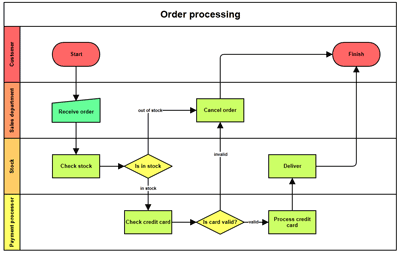
What is Swim Lanes?
100
What does UCL and LCL Stand for?
What is Upper Control Limit and Lower Control Limit?
200
What is an example of Continuous Data?
What is Time, Distance, Weight, etc.? Continuous data are measured on an infinitive scale.
200
What is the difference between Non-Value added (NVA) and Business Non-Value Added (BNVA)?
What is BNVA is truly NVA, but done for regulatory reasons or to keep the lights on.
200
What is a measurement error from two or more people taking repeated measures of the same part with the same measurement tool?
What is Reproducibility?
200
What does SIPOC stand for?
S = Supplier
I = Input
P = Process
O = Output
C = Customer
200
This step realizes the relationship between Voice of Customer (VOC) and Voice of Process (VOP).
What is Process Capability?
300
These are two ways to choose a sample.
What is randomly and systematically?
300
What tool can be used to depict Value Add on the Value Stream Map?
What is a time line with Customer Value Adds (CVA) activities in the lower steps and NVA or BNVA activities in the upper steps.
300
What is the difference between defects and defective?
Defects (noun) can be counted and there can be multiple.
Defective (adjective) It describes what is wrong with the product.
300
This process map shows the work flow through various departments or work areas. Best used for finding inefficiencies in the layout of the work area.
What is Spaghetti mapping?
300
What does DPMO stand for?
What is Defects per Million Opportunities?
400
What are three of the five things to consider when building a data collection plan?
Process or Population
Data Type
Objective
Familiarity
Certainty
400
What are the 3 C's of Customer Value Add?
What is Cares, Change and Correct.
400
Why do we need to know what kind of data we have to use a control chart?
Different Chart are used for attribute and continues data. We need to use the proper one to get the proper reading necessary to determine process stability.
400
This process map expands from the SIPOC to get to an area of focus. Best used when trying to redefine the scope.
What is Top-Down Process Map?
400
What popular dance was discussed in yesterday’s class?
What is the Nae Nae?
500
In continuous improvement, we talk about these three voices of data.
What is Voice of the Customer (VOC), Voice of the Business(VOB) and Voice of the Process (VOP)?
500
What does the acronym TIM K WOOD mean?
What is Transportation, Inventory, Motion, Knowledge, Waiting, Over-processing, Over-production, Defects
500
What are the steps in the 3 step dance?
What is Measurement System Analysis(MSA,) Statistical Process Control (SPC) and Process Capability?
500
This process map depicts the process showing the flow of material and information required to deliver a product to customer. It contains data and flow not typically shown on other types of process maps.
What is Value Steam Mapping?
500
What are the four deliverables for the Measure Phase?
What is:
Data Collection Plan, Output/Input Metrics, Measurement System Analysis, Baseline Performance (Control Charts to validate process stability and process capabilities analysis)