position vs time
distance vs time
velocity vs time
acceleration
all about the line
100
Based on the graph the object starts at this position.

What is 6 m in the negative direction or -6 m?
100
According to the graph the object is going towards its starting location during this time interval. 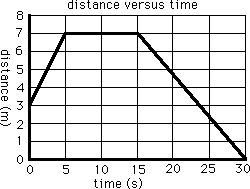
What is 15 to 24 seconds? (notice the slope is negative and the object started at +3 m so at about 24 s the object is at its starting location again)
100
According to the graph the car is traveling at a
(1) constant speed over this time interval.
(2) has a zero velocity at this time.
(3) the object is changing direction?

(1) What is section B to C or 10 to 15 s?
The areas where the graph is flat shows constant speed.
(2) What is 0s, 30 s, and 55s?
(3) What is 30s?
the object had been going in the positive direction and slowing down - at this time it comes to a breif stop - before going in the negative direction and speeding up.
100
According to the graphs, there is the largest acceleration over this time interval.
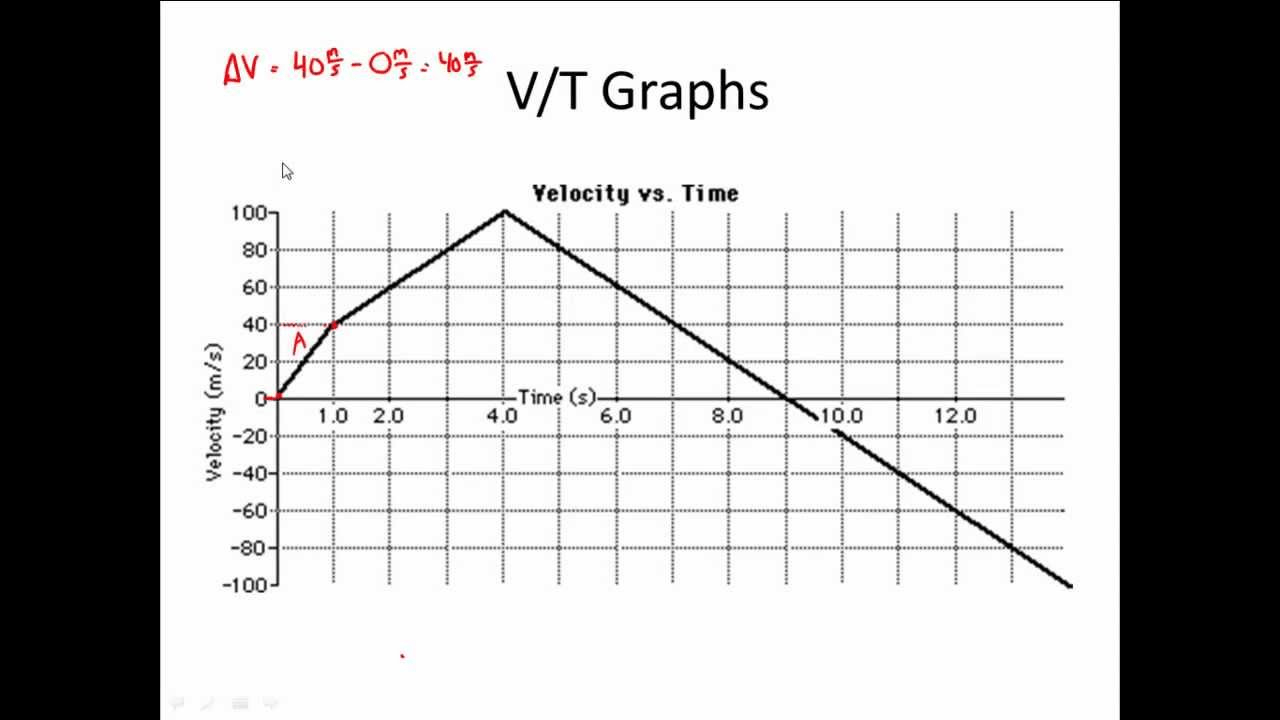
What is a or 0 to 1 s?
The slope of the vvt graph is the acceleration over the time interval
A +40 m/s^2
B (60/ 4) = 15 m/s^2
C (200/ 12) = 16.7 m/s^2
100
A flat horizontal line on this graph means that the object remains a constant location.
What is position vs time or distance vs time graph?
200
Based on the graph below, the object has traveled this far after 14 seconds.
What is 18.0 m?
From 0 to 4 seconds (start at -6 m and travel to +6 m so total distance of 12 m)
from 4 to 8 seconds remains at +6 m so no additional distance traveled
from 8 to 14 seconds (start at +6 and travel to reference position 0m so total distance of 6 m)
total over the 14 second time interval 18 m
200
Based on the graph the object's displacement is
What is -27m?
notice that it started at 3 m and on the return trip went 27 meters past its starting position or 27 meters left of where it started.
200
The total displacement this object undergoes. 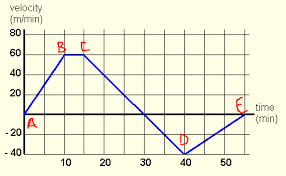
What are 550 m in the positive direction or +550m?
from 0 to 10 seconds
1/2 (10)(60) = 300 m in the positive direction
from 10 to 15 seconds
5 *60 = 300 m in the positive direction
15 to 30 aeconds
1/2 (60)(15) = 450 m in the positive direction
from 30 to 40
1/2 (10)(-40)
200 m in negative direction
from 40 to 55
1/2 (15)(-40)
300 m in the negative direction
so total displacement
300 +300 +450 -200-300 = +550 m
200
According to this set of graphs the object's acceleration is 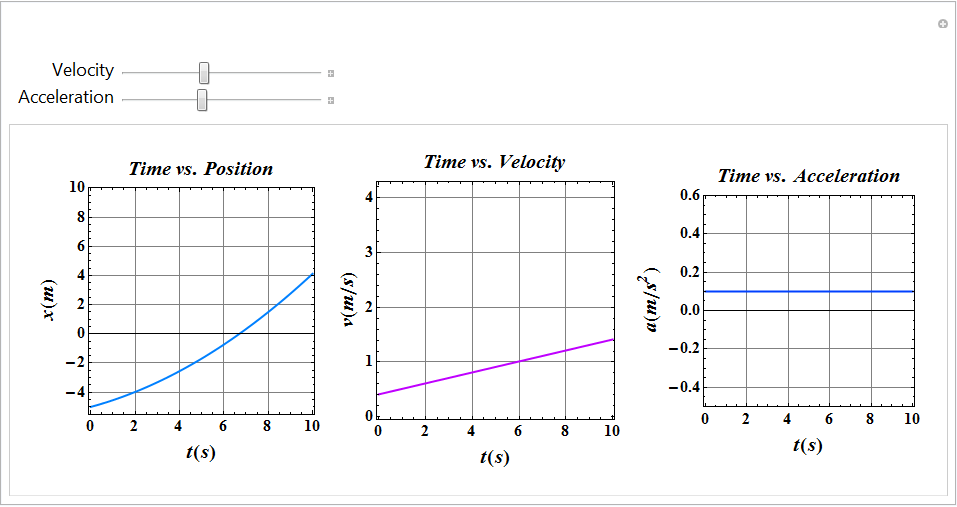
What is 1 m/s^2?
200
A curved line on this graph means that the object is accelerating.
What is position vs time or distance versus time graph?
300
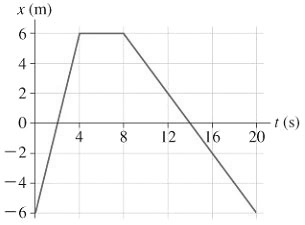
Based on the graph what is the object's displacement in 14 seconds is____ m

What is +6 m?
Notice it starts at 6 m in the negative direction of the reference and ends at 0 m (the reference position).
Displacement is straight line distance between start and end location reported with its direction
so the object is displaced 6 m in the positive direction from its starting location.
300
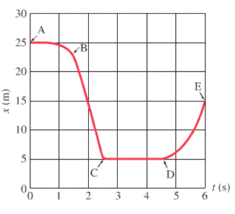
According to the graph the bicyclist is traveling the fastest during this section (ignore section E where speed changes).
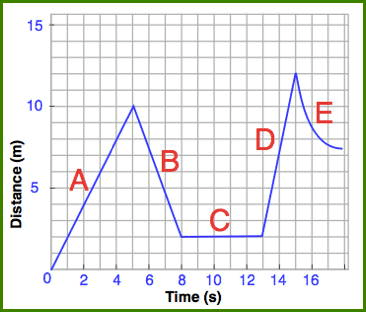
What is section D?
We are looking for the steepest section of graph.
300
According to the graph the object is slowing down during this time interval.
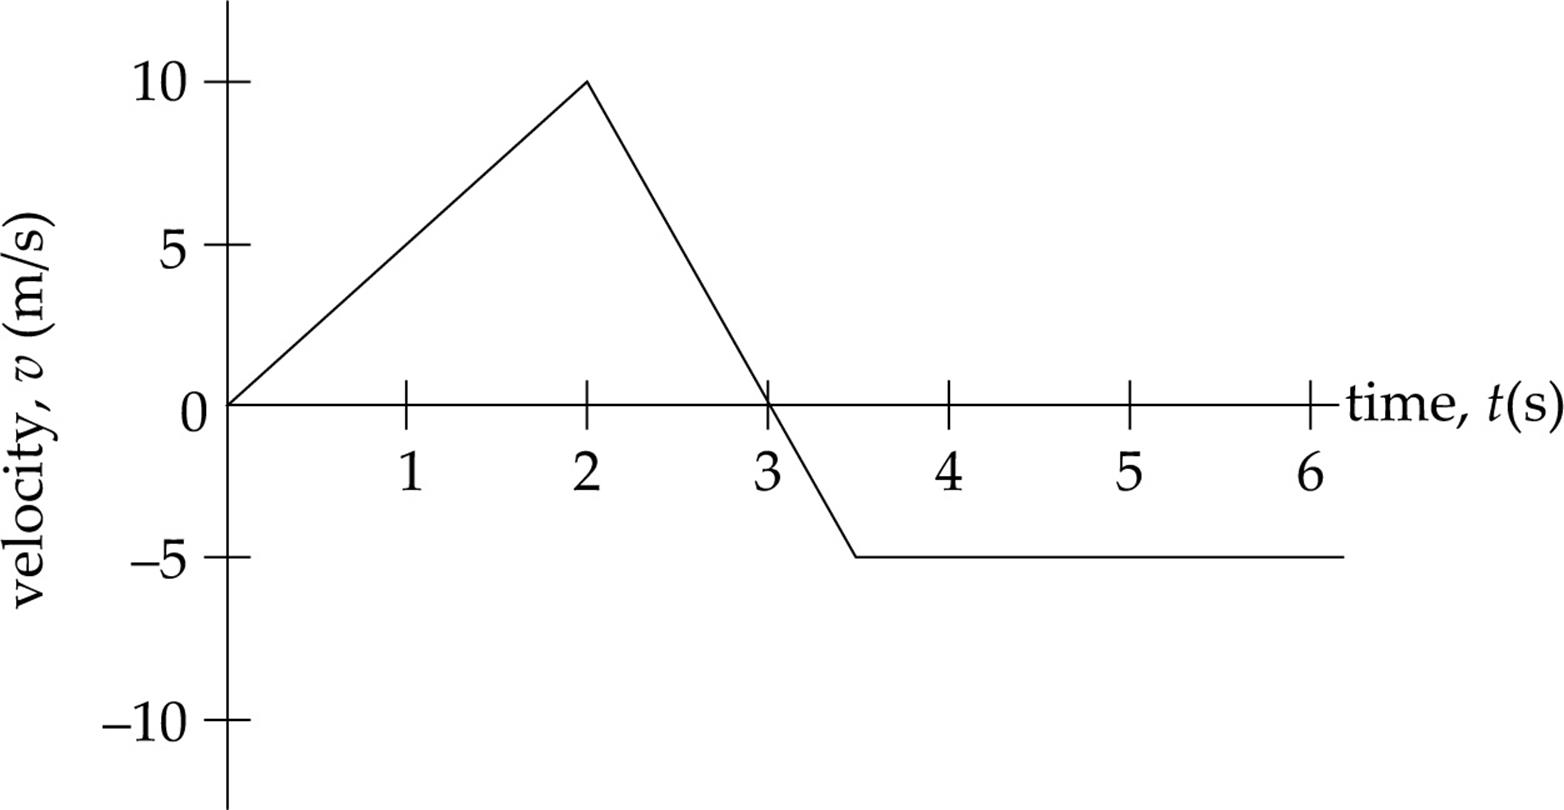
What is 2 to 3 seconds?
Be careful over the 3 to 3.5 second time interval the object is traveling in the negative direction and speeding up.
300
True or False. All of the graphs show an object which is accelerating for at least part of their journey.
What is True? Note we will not be testing over graphs b and d since the acceleration is not constant in either of these.
300
A flat horizontal line on this graph means that the object has a constant acceleration.
What is an acceleration vs time graph?
400
According to this graph
(1) this object is at rest.
(2) this object is moving the fastest
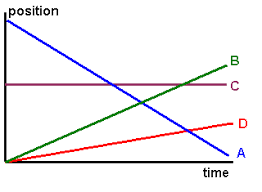
(1) What is object C?
(2) What is object A?
notice that the pvt graphed line for C is horizontal showing that the position is not changing over time. So the object is at rest.
Notice that A starts a far distance away and ends near the reference location. This occurs in the same amount of time that B and D start at the reference location and travel some smaller distance. B is going faster than D.
Remember that even if we said which has the largest velocity that A would still be correct. It is moving in the negative direction. To determine largest value we are looking at the magnitude not the direction.
Largest + velocity would be B but that is not what is asked.
400
According to the graph, this object has traveled the greatest distance at 2 seconds. 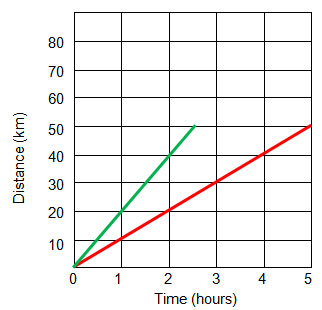
What is the green object? notice it has gone 40 km at 2 seconds and the red object has only gone 20 km at that same time
400
According to the graph the object is changing directions at this time(s).
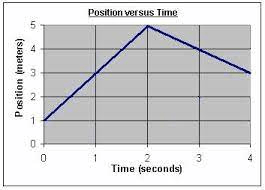
What is 2 seconds?
from 0 to 2 seconds the object travels in the positive direction (notice the position is getting more positive and the slope of the graphed line is positive).
At 2 seconds there is a momentary stop in the motion(notice the slope of the graph at 20 seconds is 0) we see a change from a line with positive slope to a line with negative slope.
from 2 to 4 seconds the position values is getting less positive and the slope of the line is negative.
400
A student turned in their lab with the following image indicating that the object was accelerating. Based on what we have studied the y axis should have been labeled _____ and the x axis should have been labeled.
What is position or displacement and time?
400
A diagonal line on this graph means that the object has a constant acceleration.
What is velocity vs time?
500
According to this graph, over this time period(s) the object
(1) slows down
(2) Speeds up
(3) changes direction
(1) What is around 2 seconds?
The object goes from non-zero negative speed to rest
(2) What is around 0.5 s, 0.5 to about 1.5, and 4.5 to 5.5 s?
the object goes from rest to a non zero speed (about 0.5 s) then it has an increasing speed in the negative direction (notice the slope of the curve is increasing as we move left to right).
Then around 4.5 seconds we go from rest to a nonzero speed and from 4.5 to about 5.5 seconds we are speeding up as we move in the positive direction.
500
According to the graph the red object has a constant speed of __________ km/hr.
What is 10 km/hr? Total distance 50 km total time 5 hours 50/5 = 10 km/hr
500
According to the graph the object is accelerating at _______ m/s^2 during the first 2 seconds.
What is 5 m/s^2?
Recall that acceleration is the change in velocity over time.
The final velocity at 2 seconds is 10 m/s, the initial velocity at 0 seconds is 0 m/s. So we have 10/2 or 5 m/s^2
500
A student turned in a graph and indicated the object had a constant acceleration. Based on what we have studied what should the y and x axis labels be?
What is velocity (y- axis) and time (x-axis)?
500
You are given the following graph of an object's motion, the shape of the velocity vs time graph will look like. 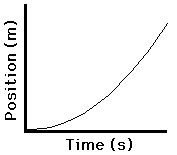
What is a diagonal line? 