Definitions
Frequency Tables
Line Plots
Bar Graphs
RANDOM!
100
What is data?
Data is information that can be collected by asking questions or observing.
100
The frequency table below represents the number of coffee cups sold at a time from a popular coffee stand.
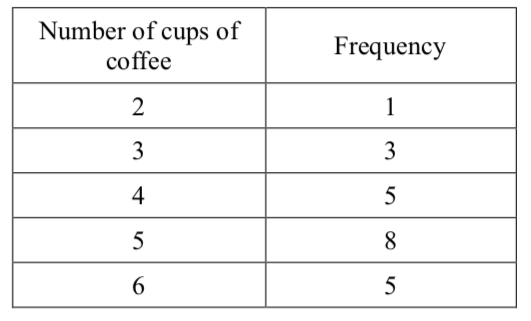 What is the most frequent number of coffee cups sold at a time?
5 coffee cups
100
The line plot below shows how many minutes 4th Grade students read last night for homework.
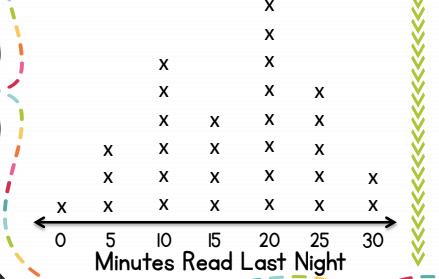
What is the most frequent number of minutes read? How many students read for that many minutes?
20 minutes, 8 students
100
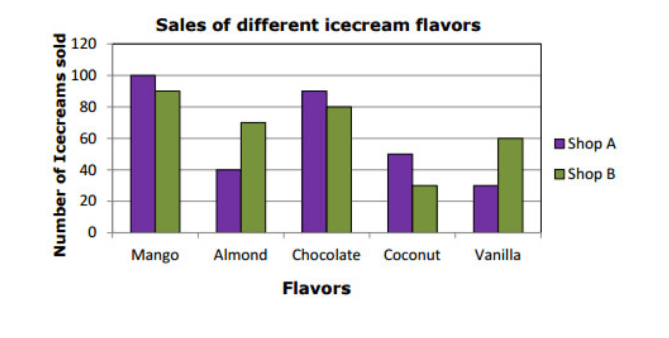
What is the least popular ice cream at Shop A? What is the least popular ice cream at Shop B?
Vanilla, Coconut
100
"Find the difference between..."
What kind of math are you expected to do here?
Subtraction
200
What is categorical data?
Categorical data is information that can be organized into categories, such as hair type, favorite colors, etc.
200
The frequency table below shows the number of hours that 4th and 5th Grade teachers at CSS get every night.
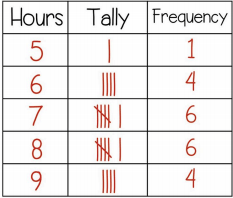
How many teachers get the greatest amount of sleep?
4 teachers
200
The line plot below shows how many minutes 4th Grade students read last night for homework.
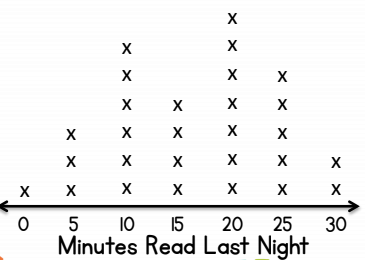
What is the most number of minutes that a 4th Grade student read last night for homework?
30 minutes
200
What is the total number of coconut ice creams sold by Shop A and Shop B?
80 coconut ice creams
200
When you are organizing a frequency table, it's important to put the data column in order from...
Least to greatest
300
What is numerical data?
Numerical data is information that represents a value. Numerical data is information that is counted or measured. Numerical data is a number!
300
The frequency table below shows the number of hours of sleep that 4th and 5th Grade teachers at CSS get every night.
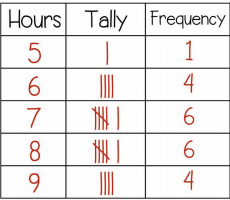
How many teachers receive between 5 and 8 hours of sleep per night?
17 teachers
300
The school secretary made a line plot to show how many days all of the students in Mrs. Delaney's class missed last year.
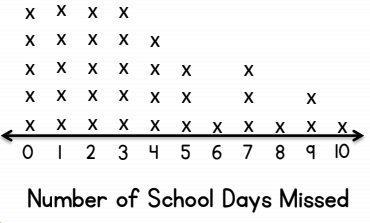
There is a school rule that states that the amount of days you are allowed to miss school is 4. How many students broke this rule?
11 students
300
The following bar graph shows how many ice cream cones were sold over four weeks during the months of July and August.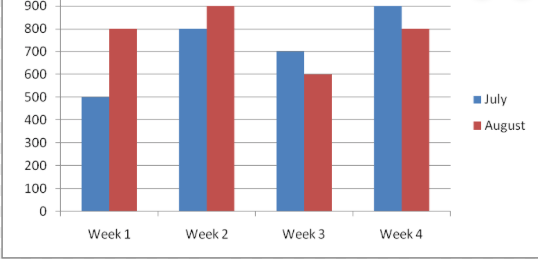
How many fewer ice cream cones were sold during the 3rd week of August than the 4th week of July?
300 fewer ice cream cones
300
A scaled bar graph is...
a bar graph that counts by any number other than 1
400
What is the definition of "frequency" as it relates to math?
"Frequency" is the amount of times a value occurs in a set of data.
400
The frequency table below shows the grades that Billy Joe Bob received on math tests throughout the first nine weeks of school.
If a 90 is the average grade on tests in math class, how many times did Billy Joe Bob score below the class average?
12 times
400
A scientist observed various frogs and how far they each hopped in feet. He created a line plot based on his findings. Each X=1 frog.

How may more frogs hopped 4 feet than the frogs that hopped 2 feet?
4 more frogs
400
The following bar graph shows how many ice cream cones were sold over four weeks during the months of July and August.
What is the difference between the total number of ice cream cones sold during the 1st and 2nd week of August and the total number of ice cream cones sold during the 1st and 4th weeks of July?
400 ice cream cones
400
WOOHOO! FREEBIE QUESTION!
Mufasa!
500
What is a frequency table?
A frequency table is a table that helps us organize our data, and it allows us to see the frequency of values in our data.
500
The frequency table below shows the grades that Billy Joe Bob received on math tests throughout the first nine weeks of school.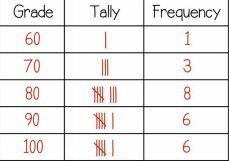
What is the difference between Billy Joe Bob's most frequent test score and his least frequent test score?
20
500
A scientist observed various frogs and how far they each hopped in feet. He created a line plot based on his findings. Each X=1 frog.
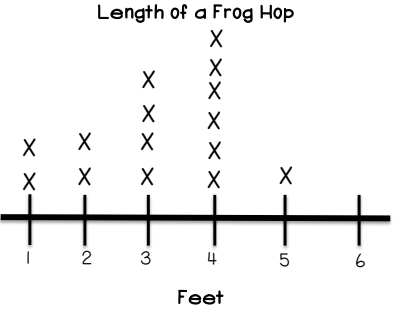
What is the total number of feet hopped by all frogs that were observed?
47 feet in all
500
The following bar graph shows how many ice cream cones were sold over four weeks during the months of July and August.
What is the total number of ice cream cones that were sold during July?
2900 ice cream cones
500
Name one survey questions that would yield numerical data and one survey question that would yield categorical data.
Great job!