Macro
Industry
Credit
Relative Value
Liquidity
100
This terminal function provides access to calendars of upcoming events and releases, so you can monitor market-moving, real-time economic developments.
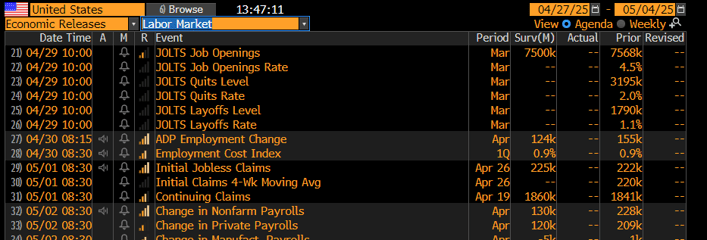
ECO<GO>
100
This terminal function allows you to see the latest performance data and history for multi-asset bellwether indicators, including the LUAC, so you can analyze periodic returns and statistical data to make informed investment decisions based on your risk analysis.
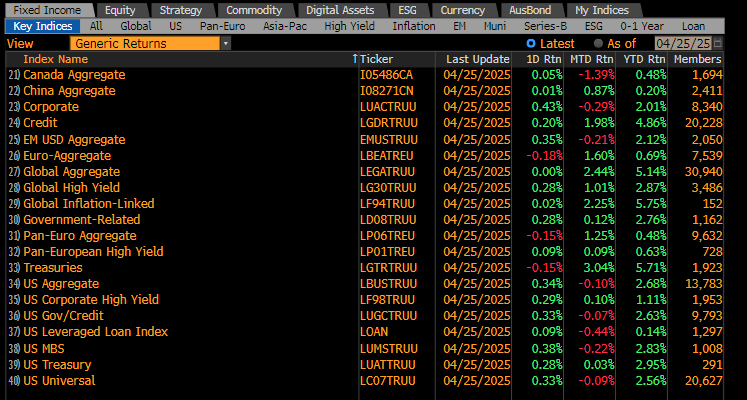
IN<GO>, INS<GO>
100
This terminal sub-page provides key credit metrics, including historical and estimates, so you can analyze a company's profitability, leverage and solvency.
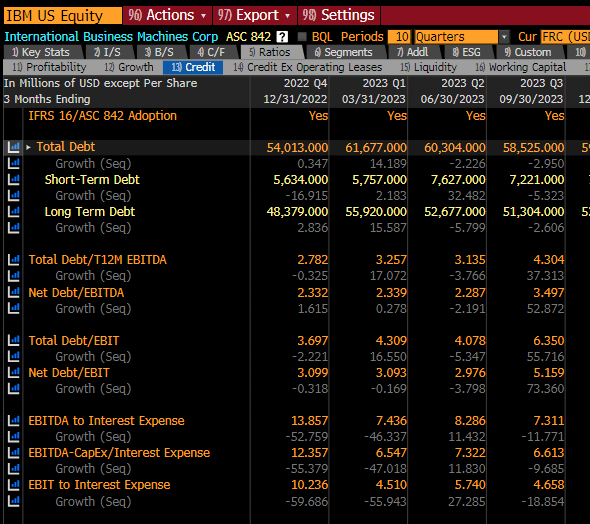
FA CREDIT<GO>
100
This terminal function allows you to create and share custom worksheets to analyze pricing, performance, relative value, and liquidity across lists of up to 20,000 instruments.
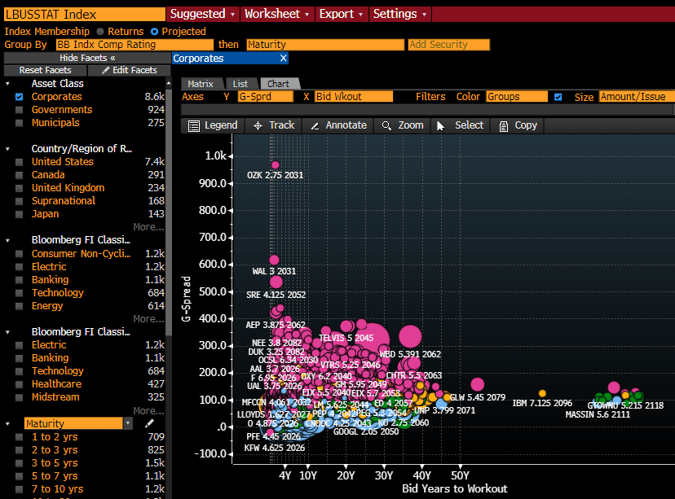
FIW<GO>
100
This terminal function aggregates real-time fixed-income quotes with indications of axed liquidity, evaluated and composite pricing, and historical trade prints, so you can analyze historical pricing, review dealer performance metrics, show or hide axes, and launch a price inquiry ticket.
ALLQ<GO>
200
This terminal function estimates the expected path of policy rate changes, so you can align your trading strategies with likely rate hikes or cuts.
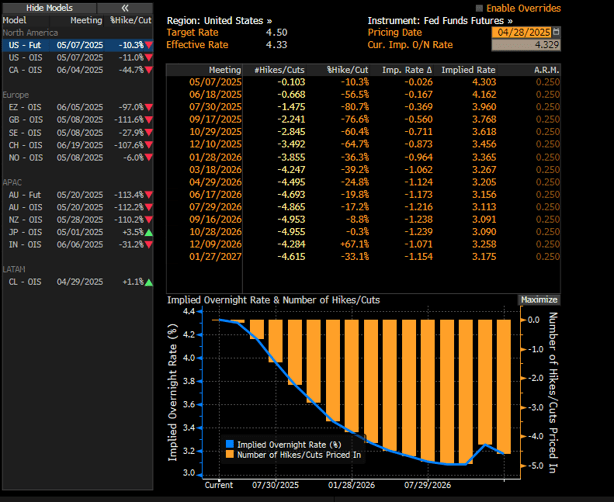
WIRP<GO>
200
This terminal function provides a high-level overview of the intraday, real-time performance of cash bonds within the investment grade, high yield, and emerging credit markets, allowing you to spot opportunities within a particular sector by comparing where spreads have tightened or widened on the day.

FICM<GO>
200
This terminal dashboard aggregates credit ratings agency data as well as alternative credit risk measures and provides transparency into rating changes, so you can assess the creditworthiness of a debt issuer or specific fixed income security.

CRPR<GO>
200
This flexible charting tool allows you to plot historical or intraday price data for a buy and a sell security, so you can analyze price performance from multiple perspectives across different chart types.

HS<GO>
200
This terminal function displays the most actively traded bonds across countries/regions and asset classes, so you can evaluate liquidity in the market where you trade. This function recently was enhanced with NLP screening capabilities.
MOSB<GO>
300
This terminal function started as a BQNT app and it allows you to analyze a range of key economic indicators, so you can pinpoint the factors driving current and historical values.

ECAN<GO>
300
This terminal function allows you to find and compare exchange traded funds, so you can identify the funds that match your investment criteria and analyze key metrics, such as liquidity and allocations, for similar funds.
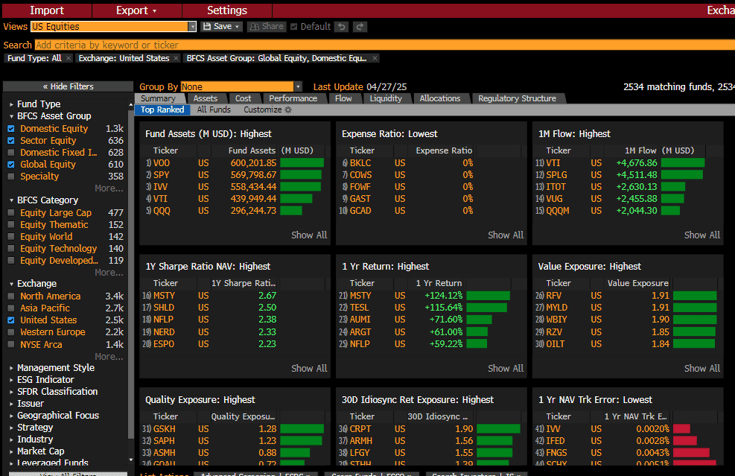
ETF<GO>
300
This terminal function helps assess default risk and provides a model CDS spread based on company financials, some of which can be found on FA CREDIT.
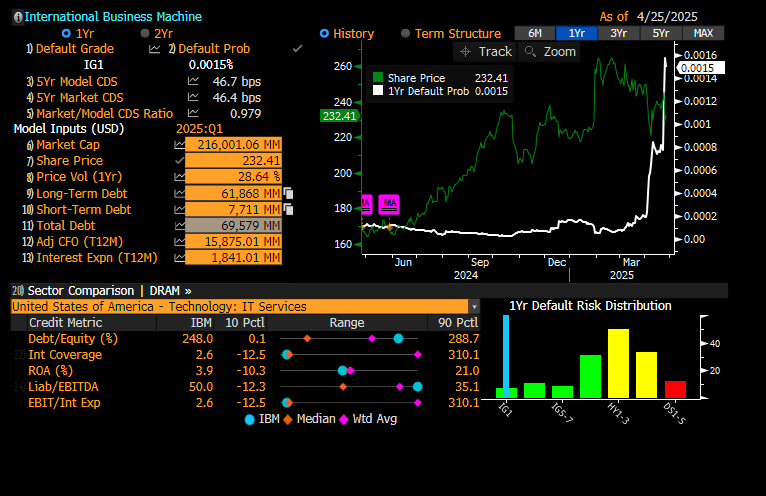
DRSK<GO>
300
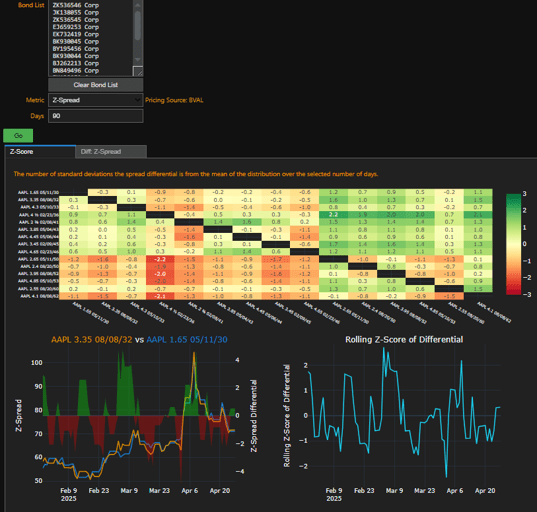
This terminal function allows you to determine the relative richness/cheapness of a corporate bond by analyzing current pricing and historical trends against a customizable list of peer securities.
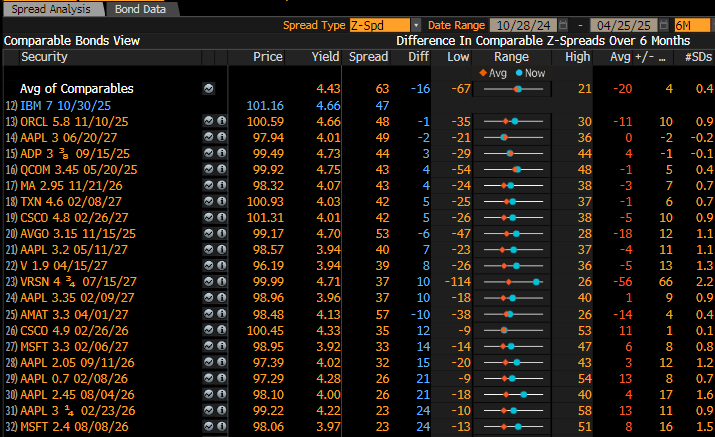
COMB<GO>
300
This terminal function consolidates indications of pricing and liquidity across multiple asset classes to provide transparency into your trading activity. Information feeds into this screen from multiple sources, including quotes mined from the Bloomberg Message (MSG) function, the Runs Manager (RUNZ) function.
IMGR<GO>
400
This terminal function provides a comprehensive overview of the current interest rate environment by tracking major rates, securities, and economic releases for over 80 countries and regions, so you can easily stay up-to-date on lending costs and the overall health of a country/region's economy.
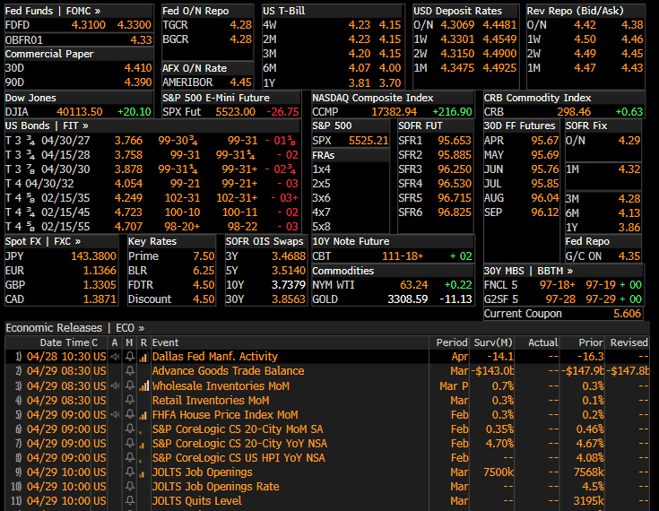
BTMM<GO>
400
This terminal function allows you to search the Bloomberg’s database for curves which are organized by type or asset class, then further divided by sector.
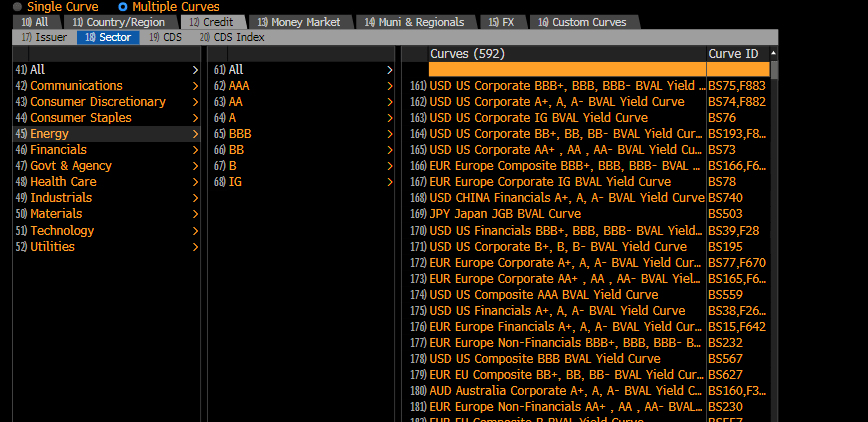
CRVF<GO>
400
This terminal function provides reported actual data, broker estimates, and Bloomberg estimates consensus data for a security. You can quickly compare metrics across all key measures, including segments, products, and company-specific operating metrics to understand what's driving a company's business.

MODL<GO>
400
This terminal function is a sister-function to FIW and allows you to perform a highly-interactive analysis of an issuer's bonds, so you can estimate yields, spreads, and other valuation metrics.
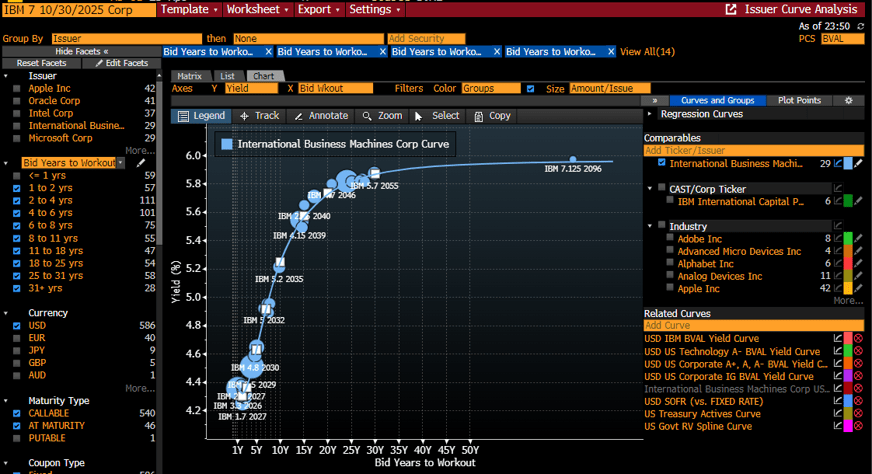
NIA<GO>
400
This terminal function provides transparent and highly defensible prices across the liquidity spectrum for a variety of fixed-income instruments, so you can obtain an independent valuation based on real-time market observations from a wealth of contributed sources.
BVAL<GO>
500
This terminal monitor provides a comprehensive overview of the international sovereign bond market, including yields, spreads, and curves from around the world.
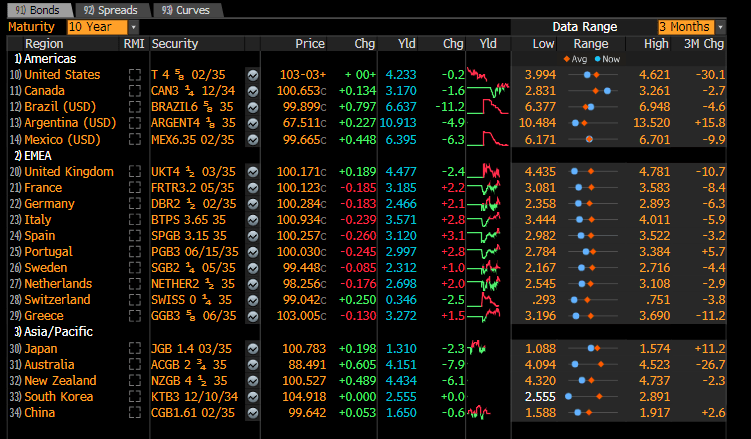
WB<GO>
500
This corporate credit dashboard screen and the associated “Data Library” provides independent research you can use to understand financial trends and themes impacting the corporate credit markets in the US.
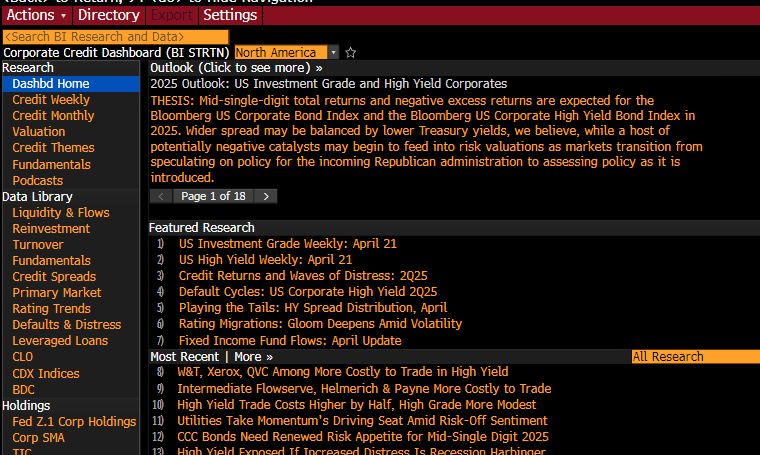
BI STRTN<GO>
500
The relatively new terminal function allows you to compare an issuer's credit fundamentals, default probabilities, and fixed income valuations to a customizable universe of peers, so you can evaluate the issuer's credit profile and quickly assess risk.

CRAN<GO>
500
This sample notebook found in Bloomberg Lab’s help center extends the functionality of COMB to compare bonds pair-wise.
Bond Pair Relative Value
500
This terminal function helps you quantitatively assess liquidity at the transaction level by combining traditional market impact models with machine learning techniques, so you can assess all the factors that influence liquidity in one place.
LQA<GO>