Correlations
Causation
Line of Best Fit
Vocabulary
100

Choice C is Positive
100
Choice D
100
If you drew a trend line through the data points below, would the association be strong or weak? 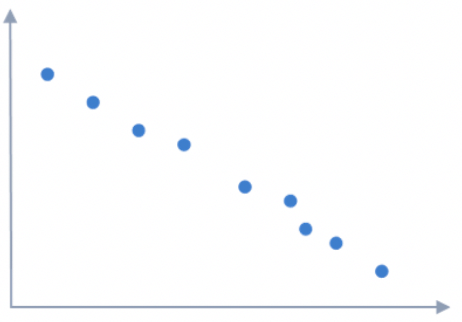
Strong
100
Data for two variables is called
A) Univariate
B) Multivariate
C) Bivariate
C) Bivariate
200
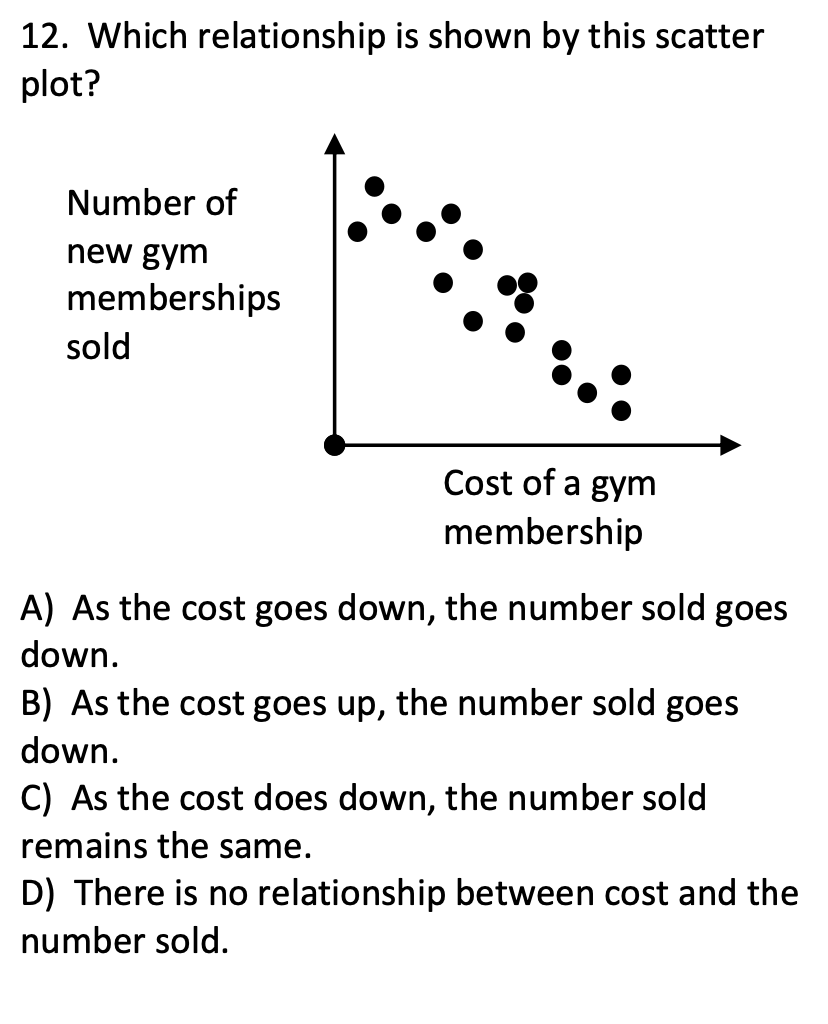
Choice B
200

Choice C
200
True or False:
A line of best fit are used on non-linear scatter plots
False
200
True or False
The x represents the independent Variable and the y represents the dependent variable
True
300
Choice D
300
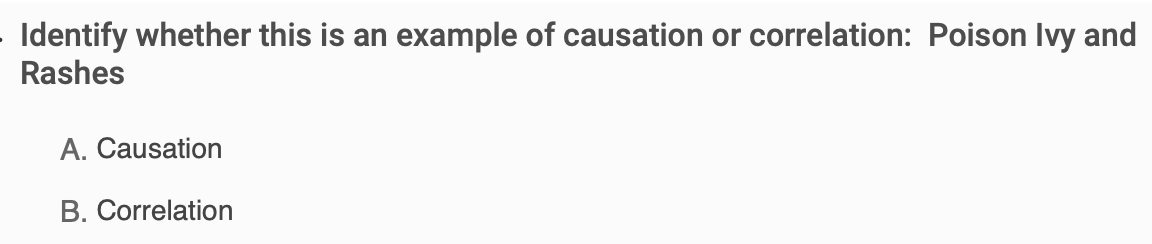
A. Causation
Poison Ivy Causes rashes
300
True or False:
The line of best fit can help us make predictions about data.
True
300
What type of correlation occurs when both the x and y variables increase?
Positive
400
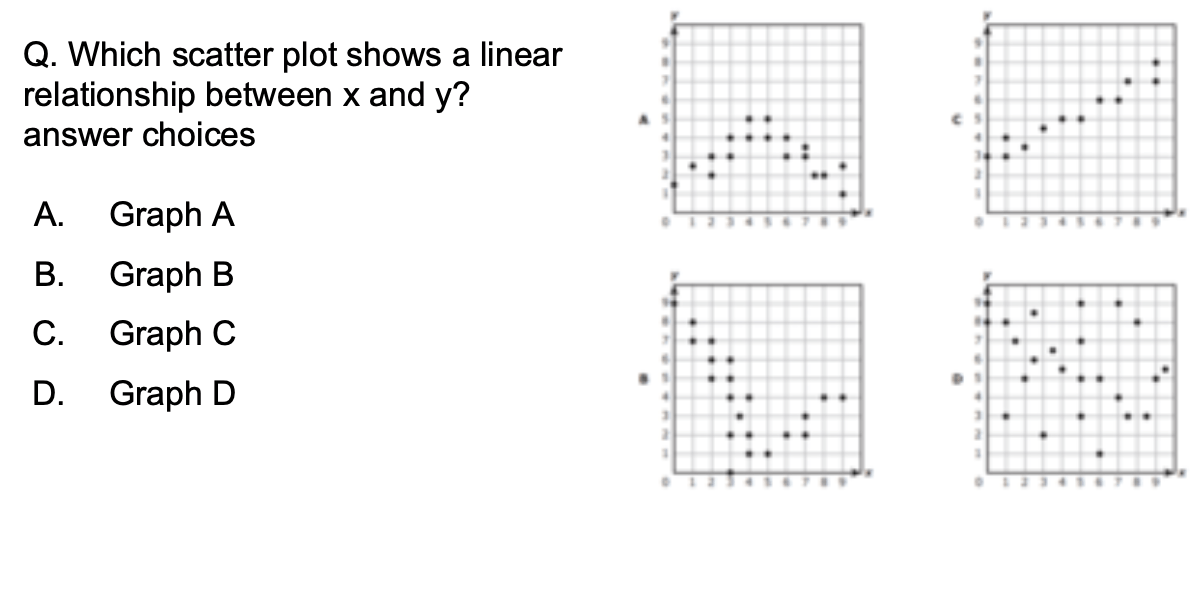
Graph C
400
Which of the following statements shows a relationship that is correlated but not causal?
The amount of rainfall received and level of water in the lake.
The number of lights left on each day and the amount of the electric bill.
The increase of warm, sunny days and the number of ice cream vendors visible.
The number of hours worked and how much money is made.
Choice 3
400
Which of the lines shown is a reasonable trend line for the scatter plot?

Line U (brown line)
400
What type of correlation would be a result of:
Outdoor temperature and amount paid to heat the house.
Negative Correlation
500
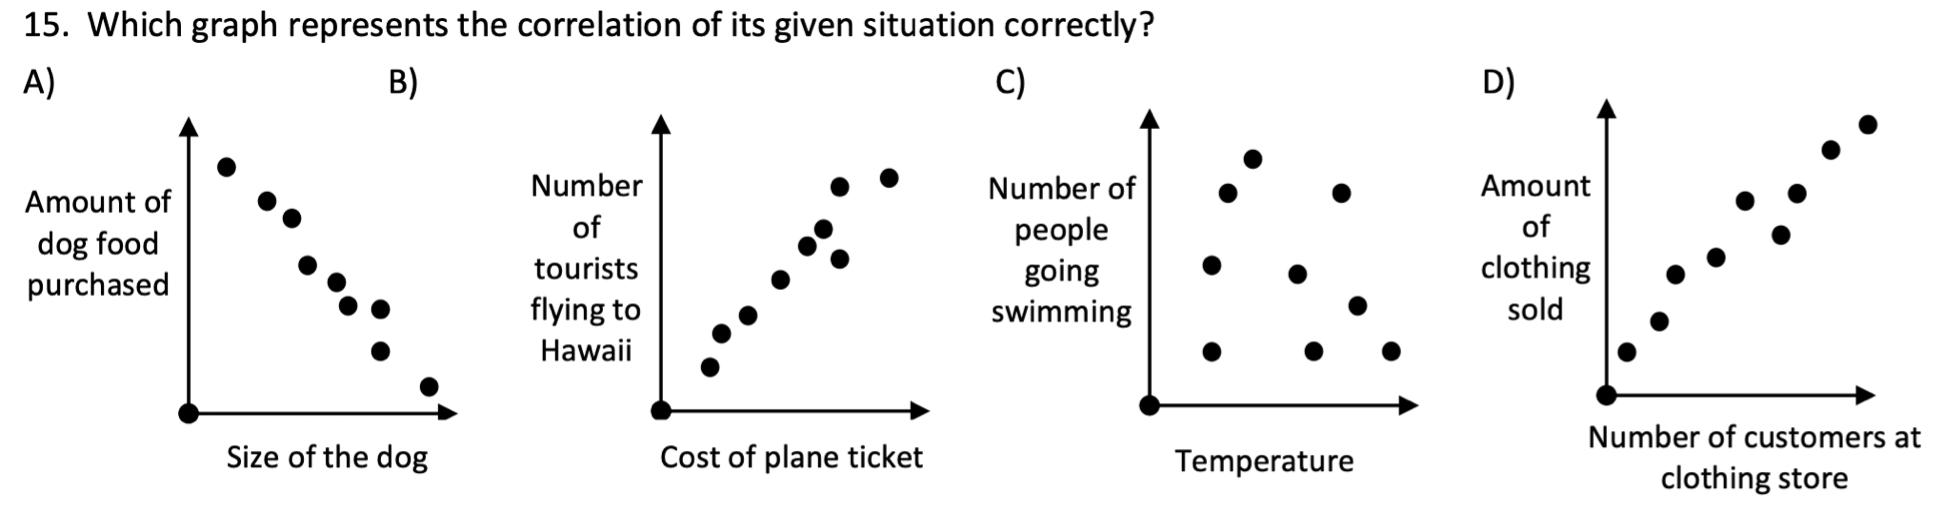
Choice A
500
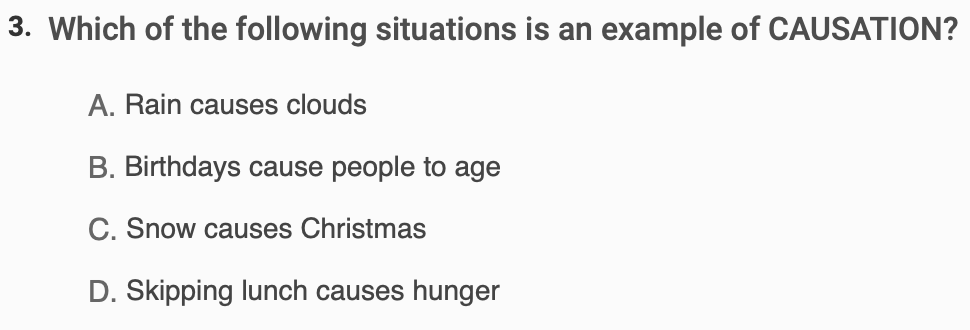
Causation' is the most likely relationship between which of the following situations?
A. hours worked and income earned
B. coffee and depression
C. temperature and weight loss
D. happiness and income earned
Choice A
500
The scatter plot shows the average height of people ages 2-12 in a certain country. Which of the lines shown is a reasonable trend line for the scatter plot? Explain your reasoning.

Linke K (blue line)
500
Another word for “rate of change” is__________
Slope