Displaying Data 1
Displaying Data 2
Measures of Center & Spread
Correlation & Regression
Math Trivia
100
What type of data display is shown below? HINT: It is used best to display change over time.
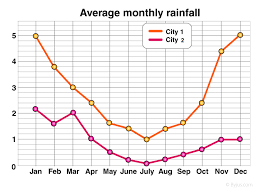
Line Graph
100
What data display is shown below? HINT: It is used to show how different variables make up a "whole".
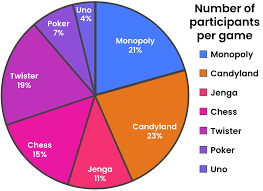
Pie Chart
100
Find the MODE of the data set:
1, 2, 3, 3, 5, 6, 7, 7, 7, 8, 9
7
100
When points are plotted on a _______ ____, examining the correlation can tell us a lot about the data.
Scatter Plot
100
What "value" does this symbol represent?

Infinity
200
What data display is shown below? HINT: It is used to show a relationship between two variables.
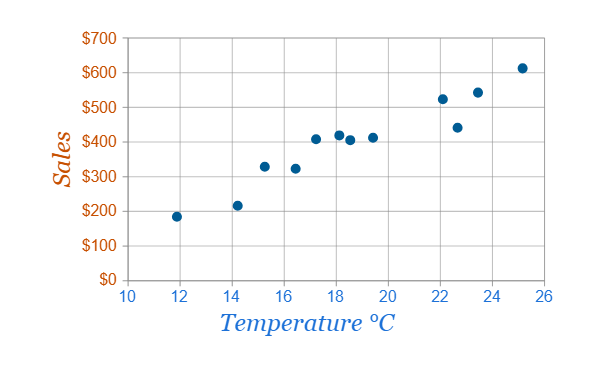
Scatterplot
200
What data display is shown below? HINT: It is used best to show large sets of continuous data.
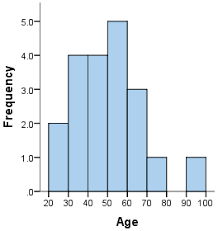
Histogram
200
What is is called when a data set has 2 modes? How about 3 modes?
bimodal; trimodal
200
The ______________ (pictured below) gives us an idea of how closely data is grouped and whether is displays a positive or negative relationship.
Line of Best Fit or Regression Line
200
Name all the prime numbers between 10 and 20.
HINT: there are 4 of them
11, 13, 17, 19
300
What data display is shown below? HINT: You would use this to display categorical data.
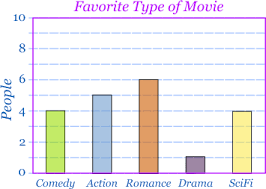
Bar Graph
300
What type of data display is shown below? HINT: You would use this to show how spread out a data set is.
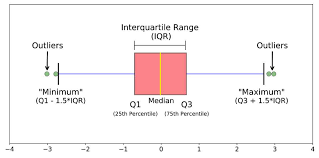
Box Plot OR Box & Whisker Plot
300
Find the MEDIAN of the data set:
1, 2, 3, 3, 5, 6, 7, 7, 7, 8, 9
6
300
Does this scatterplot show a strong or a weak positive correlation?
Weak
300
What movie features the expression pictured below? "The limit does not exist!"

Mean Girls
400
You gathered data on different people's heights and shoe size. What type of data display method would be the best way to show this information?
Scatter Plot
400
You gathered data on the amount of homework teacher's assign as it gets closer to Christmas Break. What data display method would be the best way to display this information?
Line Graph
400
What is the RANGE of the data set?
1, 2, 3, 3, 5, 6, 7, 7, 7, 8, 9
8
400
Does this scatterplot show a strong or weak positive correlation?
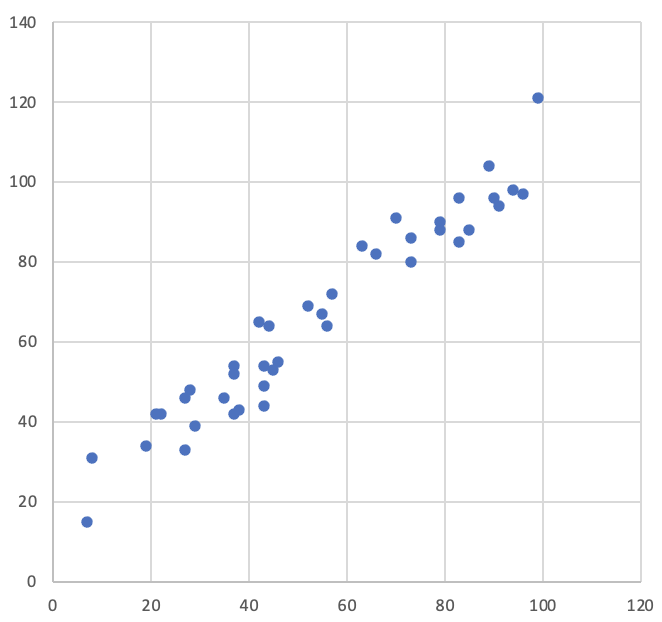
Strong
400
Binary number systems, often found in computer programming, use only what two digits?
0 and 1
500
Sketch a BAR GRAPH that represents the following data set about people's favorite holiday:
Christmas: 10
Halloween: 9
Thanksgiving: 3
(on board)
500
Create a PIE CHART to display the following data:
100 people were asked their favorite fast food, here are the results:
Taco Bell: 75
McDonalds: 20
KFC: 5
(on board)
500
What is the MEAN or AVERAGE of the data set:
1, 2, 3, 3, 5, 6, 7, 7, 7, 8, 9
(round your answer to the nearest hundredth place)
5.27
500
Describe the correlation (strong/weak, positive/negative) of this scatterplot:

Weak Negative
500
This square pyramid, located outside the Louvre Museum, is located in what European city?

Paris, France