Measure of Center
Box Plots
Statistical Questions and Dot Plots
Histograms
Misc.
100
The "average" of a set of data
Mean
100
What is the median of the lower half of the data?
The lower quartile or first quartile
100
Is it a statistical question?
You want to know how old your friend's mom is.
no
100
What type of graph is a histogram? (What is it similar to?)
Bar graph
100
Find the Mean.
2, 4, 5, 6, 2, 3, 1, 1
3
200
How must data be organized before you can find the median?
in order from least to greatest
200
____ is a display that shows how the values in a data set are distributed or spread out using medians.
A box plot
200
Is this a statistical question?
How many people normally attend Rays games.
yes
200
Histograms represent (choose a or b)
a) simple data values
b) frequencies of numeric data in intervals
b
200
Find the median.
5, 7, 10, 3, 6, 7, 2
6
300
Explain how to find the mean of a data set
Add the data values and divide by the number of the data values
300
What values are used as the endpoints of a box plot?
The least and greatest values (maximum and minimum)
300
What are data values that are either much greater or much less than the other data values?
Outliers
300
True or False
Histograms and dot plots are the same.
False
300
Find the range.
4, 10, 17, 22, 30
26
400
Find the median:
1, 4, 6, 8, 10, 17
7
400
Find the range:
2, 4, 7, 8, 10, 12, 25
23
400
Find the outlier.
20, 23, 27, 22, 9, 25, 23
9
400
How many weighed 3 kilograms?
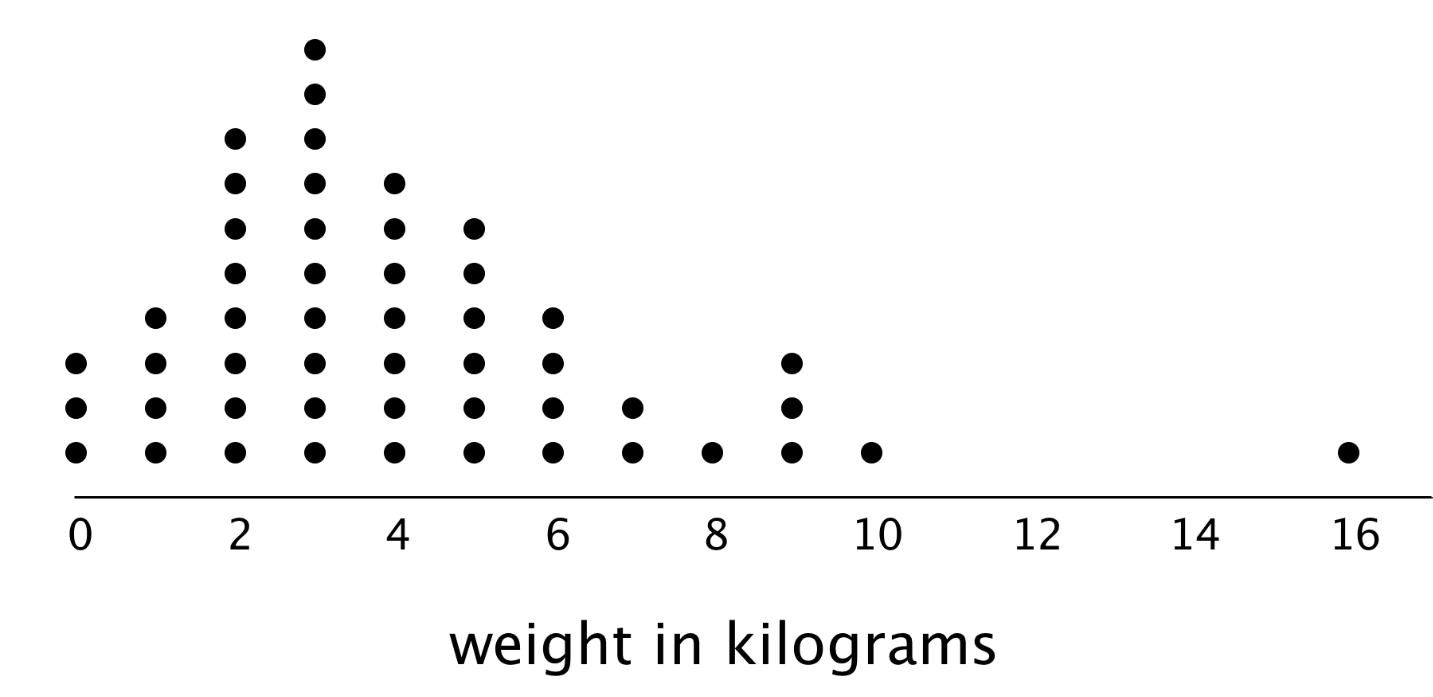
10
400
Find the median
2.8, 8.0, 4.2, 2.35, 7.4, 4.2, 9.52, 10.8, 4.01, 16.25
5.8
500
Find the mean:
1, 3, 5, 7, 2, 6
4
500
If the lower quartile is 10 and the upper quartile is 22, what is the IQR (interquartile range)?
12
500
In a dot plot, each value is represented by a...
dot
500
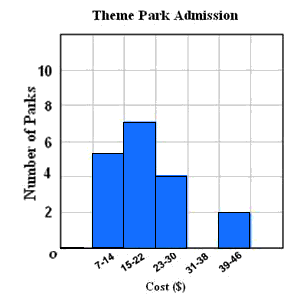
How many park's admission cost $15.00 or more?
13
500
Find the mean.
138, 317, 257, 62, 198, 375, 459, 982, 835, 77
370