Dot Plots
MMMR
Vocabulary
Box Plots
Histograms
100
How many total families are represented in the dot plot?
19
100
[ 5, 7, 7, 7, 8, 11, 15, 93]
Find the mean of the data set.
19.125
100
What do you do to find the range?
maximum - minimum
subtract the smallest number from the largest number
100
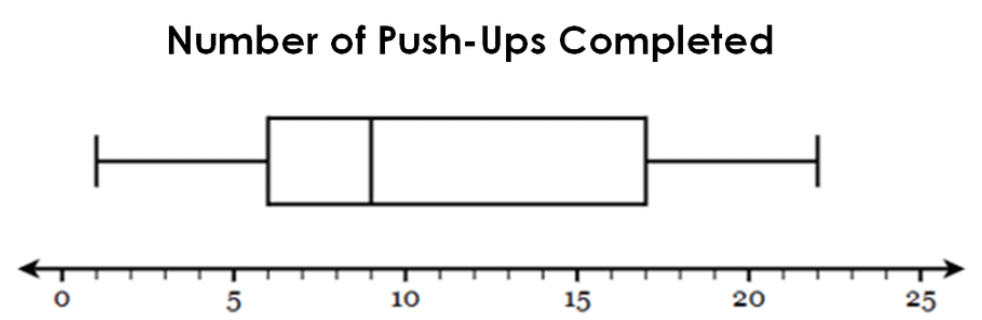
The _____ is at 6 and the _____ is at 17.
- lower quartile (Q1)
- upper quartile (Q3)
100
Is there a gap in the data? If so, explain where it is.

yes, between 80 and 90.
200
What is the mode of the data?
What is the range of the data?
Mode: 1
Range: 6
200
[ 5, 7, 7, 7, 8, 11, 15, 93]
Find the range of the data set.
88
200
What do you do to find the median?
-order numbers from least to greatest
-find the middle value
200

What is the Interquartile range (IQR) of the data?
11
200
What is the shape of the data?
skewed right
300
If another family was added to the dot plot and they had 12 children in the family, how would that affect the mean of the dot plot?
It would increase
300
[ 11, 5, 7, 8, 15, 93, 7, 7]
Find the median of the data set.
(7+8)/2=7.5
300
What do you do to find the mean?
- add all values together
- divide by the count of values that were added
300

The range of the data is _____ .
21
300
The histogram shows the amount of time, in minutes, that students spend playing video games each day.
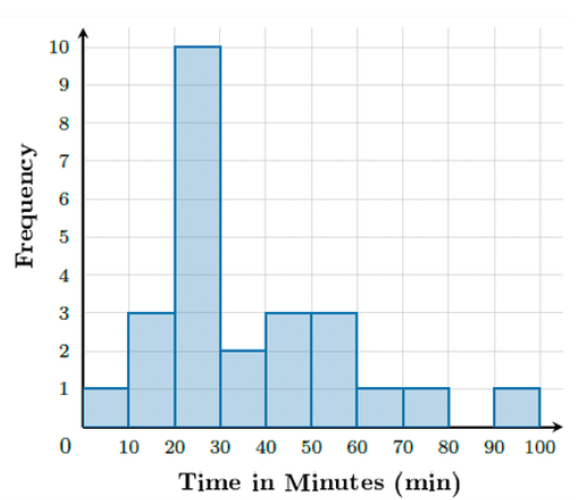
How many students spend 60 or more minutes playing video games?
How many spend 20 or less minutes playing video games?
60 or more: 3
20 or less: 4
400
What is the shape of distribution of the dot plot, skewed left, skewed right, or symmetrical?
Skewed right
400
Mean, Median, Mode and Range of this data:
[4, 2, 3, 5, 5, 6, 2, 5]
Mean: 4
Median: 4.5
Mode: 5
Range:4
400
How do you find the interquartile range?
Q3 - Q1
find the difference or distance between the lower and upper quartiles.
400

What percent of people in the data completed less than 17 push ups?
75%
400
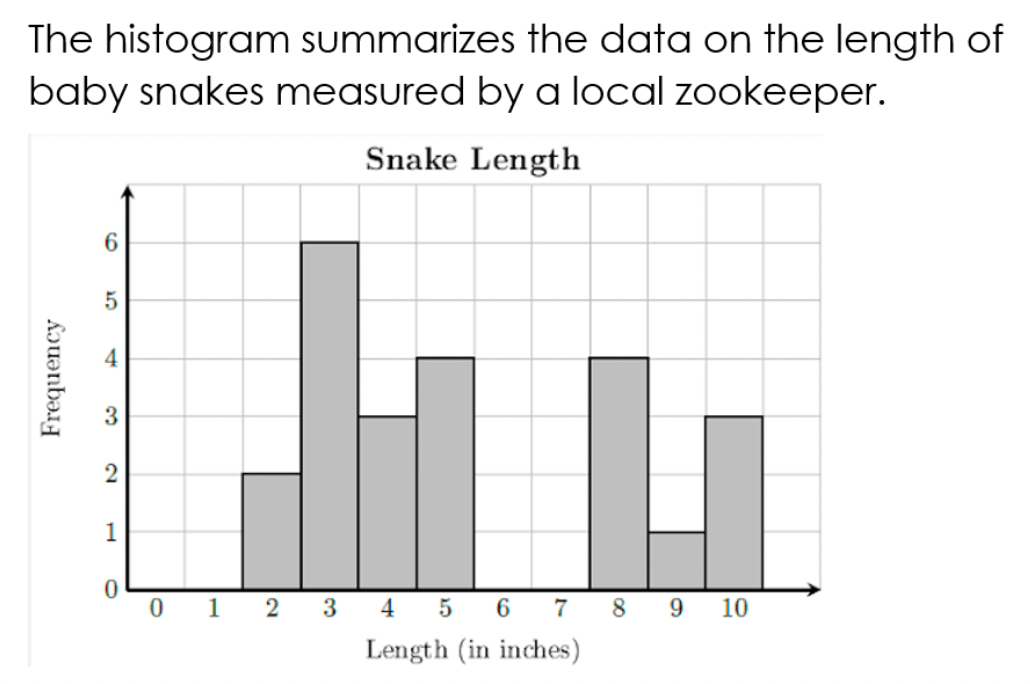
How many snakes are less than 4 inches long?
8