Measures of Center
Box-and-Whisker
Stem-and-Leaf
Outliers
5 Number Summary
Data Distribution
100
The average of the data
What is mean
100
Each box and each whisker represents this percent
What is 25%
100
The part of each number that becomes the leaves
What is the last digit
100
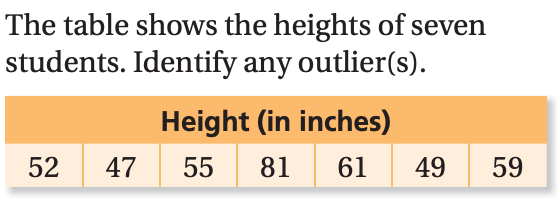
What is the outlier? 3,2,7,22,12,15,40
outlier-40
100
Find the Minimum of the following numbers:
84, 88, 72, 74, 98, 16, 94
16
100
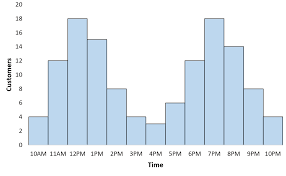
This graph is an example of a graph
skewed right
200
The number that appears most often
What is mode
200
the median of the lower half
What is lower quartile
200
What's the range?

86
200
what is the outlier? 22,13,14,0,29
Outlier = 0
200
Find the Maximum of the following numbers:
84, 88, 72, 74, 98, 16, 94
98
200
This graph is an example of the graph being
skewed left
300
The middle number in a set of data
What is median
300
the median of the upper half
What is upper quartile
300
For the stem and leaf plot, what is the interquartile range?

22
300
What equations do you use to find the the upper and lower fences (bounds)?
Lower: Q1 - 1.5 x IQR
Upper: Q3 + 1.5 x IQR
300
Find the Median of the following numbers:
84, 88, 72, 74, 98, 16, 94
84
300
Draw a histogram that is uniform
see graphs
400
Find the mean of 20, 40, 60, and 80
What is 50
400
What is the interquartile range for the information shown in the box and whisker plot?

5
400
Make a stem and leaf plot for the following data:
34, 45, 41, 56, 51, 67, 62, 70, 71
________
3 | 4
4 | 1 5
5 | 1 6
6 | 2 7
7 | 0 1
400
81
400
What is the Q1 of this data set?
6, 7, 2, 1, 5, 2, 1, 6
1.5
400
This an example of a _____________ graph
bimodal
500
Find the median of 20, 30, 40, 50
What is 35
500
For the information shown in the box and whisker plot, what are the median, range and interquartile range?

Median = Q2 = 6.5
Range = Highest value - Lowest value = 14 - 0 = 14
Interquartile range = Q3 - Q1 = 12 - 2 = 10
500
What is the median of the stem and leaf plot?

32
500
What is the outlier? 19,14,12,2,3,0,15,23
No outlier
500
When finding median and the middle has two numbers instead of one, what do you do?
Take the average
500
This histogram is most likely
symmetric