Dot Plots
Stem and Leaf Plots
Histograms
MMMR
100

What is the mode of this data?
10 minutes
100
 What is the mode of this data?
4 years old
100

What type of data (categorical v quantitative, continuous v discrete) is represented here?
What is categorical, discrete data?
100
Find the mode:
82, 23, 59, 94, 70, 26, 32, 86, 87, 94, 32
32 and 94
200

What is the shape of this data?
symmetric
200
What is the range of this data?
65 years
200
This is the mode.
Cars
200
find the median:
53, 44, 10, 45, 59, 97, 77
53
300
What is the shape of this data, and which scenario would it most logically match?
A) number of sit-ups a random sample of MW students can complete in 1 minute.
B) scores on a statistics test
C) numbers of hot-dogs eaten in a hot-dog eating contest
D) number of calories in a single serving of a variety of snack foods
skewed left
B or D, depending on your reasoning (but B matches best)
300
What is the shape of this data?
Skewed right
300
The number of vehicles included in this sample.
What is 98?
300
Find the mean, median, and mode:
4, 5, 7, 6, 6, 7, 6
mean = 5.85
median = 6
mode = 6
400
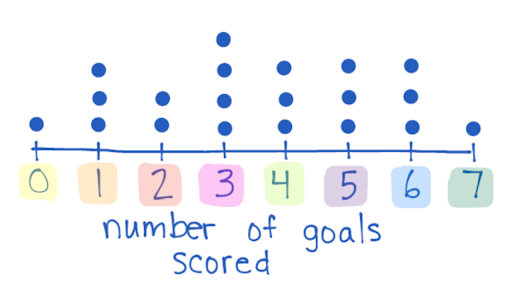
3.5
400
What is the median of this data?
28 years
400
 Let this bar graph represent the number of days in each month each student had pizza for dinner. Who always eats the least amount of pizza?
Jody
400
Find the mean, median, mode and range:
86, 13, 60, 55, 61, 97, 30, 98, 79, 52, 18
mean: 59
median: 60
mode: none
range: 85
500
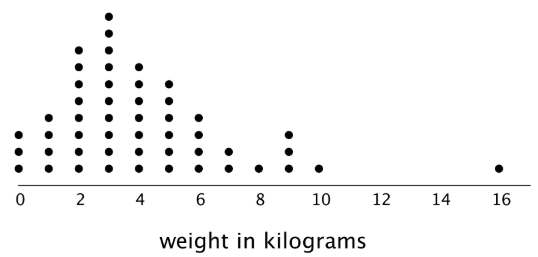
Which is greater: the mean or the median? Why?
The mean will be greater due to the skewing influence of the 16kg weight.
500
How would you represent someone 100 years old on this stem and leaf plot?
stem: 10 leaf:0
500
Let this bar graph represent the number of times each student ate pizza for dinner. What was the largest number of times one person ate pizza for dinner over the course of this study?
Sophia ate pizza for dinner 39 times over the course of the 4 months.
500
Find the mean, median, mode, and range:
9, 19, 16, 9, 16, 2, 14, 8, 2
mean: 10.55
median: 9
mode: 9, 16, 2
range: 17