Mean, Median, Mode, & Range
Case Study
Vocabulary
Box and Whisker
Frequency Tables
100
The mode of this data set:
6, 5, 2, 9, 6, 3, 0
What is 6?
100
The population of our Case Study?
What is the 7th Grade at MGMS?
100
The entire set of items from which data can be selected.
What is population?
100
The median of this Box and Whisker Plot:

What is 30?
100
The mode of this frequency table:

What is 2?
200
The range of this data set:
4, 7, 9, 2, 4, 9, 12, 6
What is 10?
200
A sample of our Case Study?
What is any math class at MGMS?
200
The data collected from part of a population.
What is a sample?
200
The minimum of this Box and Whisker Plot:

What is 15?
200
The Median of this frequency graph:
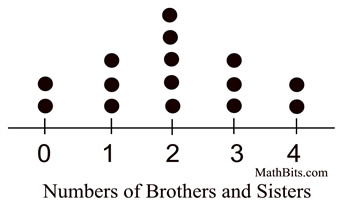
What is 2?
300
The median of this data set:
0, 1, 3, 5, 6, 8, 9
What is 5?
300
The average number of pieces of trash collected by each 7th grader at MGMS?
What is 4.8?
300
The facts or numbers gathered by a survey
What is data?
300
The Upper Quartile (Q3) of this Box and Whisker Plot: 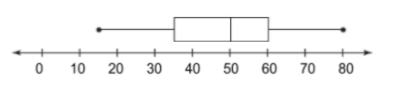
What is 60?
300
The gap in this frequency graph:
What is 17?
400
The median of this data set:
6, 4, 0, 1, 7, 2, 5, 3,
What is 3.5?
400
The most frequent number of pieces of recyclable plastic collected by 7th graders at MGMS.
What is 0?
400
A method of collecting information about a certain group of people by asking a question or set of questions.
What is a survey?
400
The Maximum of this Box and Whisker Plot:
What is 60?
400
The skew of this frequency graph:
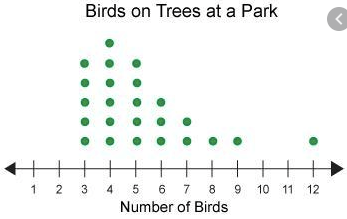
What is skewed right?
500
The mean of this data set:
3, 8, 7, 4, 9, 5
What is 6?
500
The skew of the frequency graph of recyclable plastic collected by 7th graders at MGM?
What is skewed right?
500
This is selected from the population in such a way that every member of the population has the same chance of being selected
What is a random sample?
500
The Lower Quartile (Q1) of this Box and Whisker Plot: 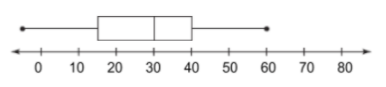
What is 15?
500
The distribution of this frequency graph:

What is symmetrical?