Histograms
Dot Plots
Box Plots
Vocabulary
Calculations
100
How many students phone bills were less than 41?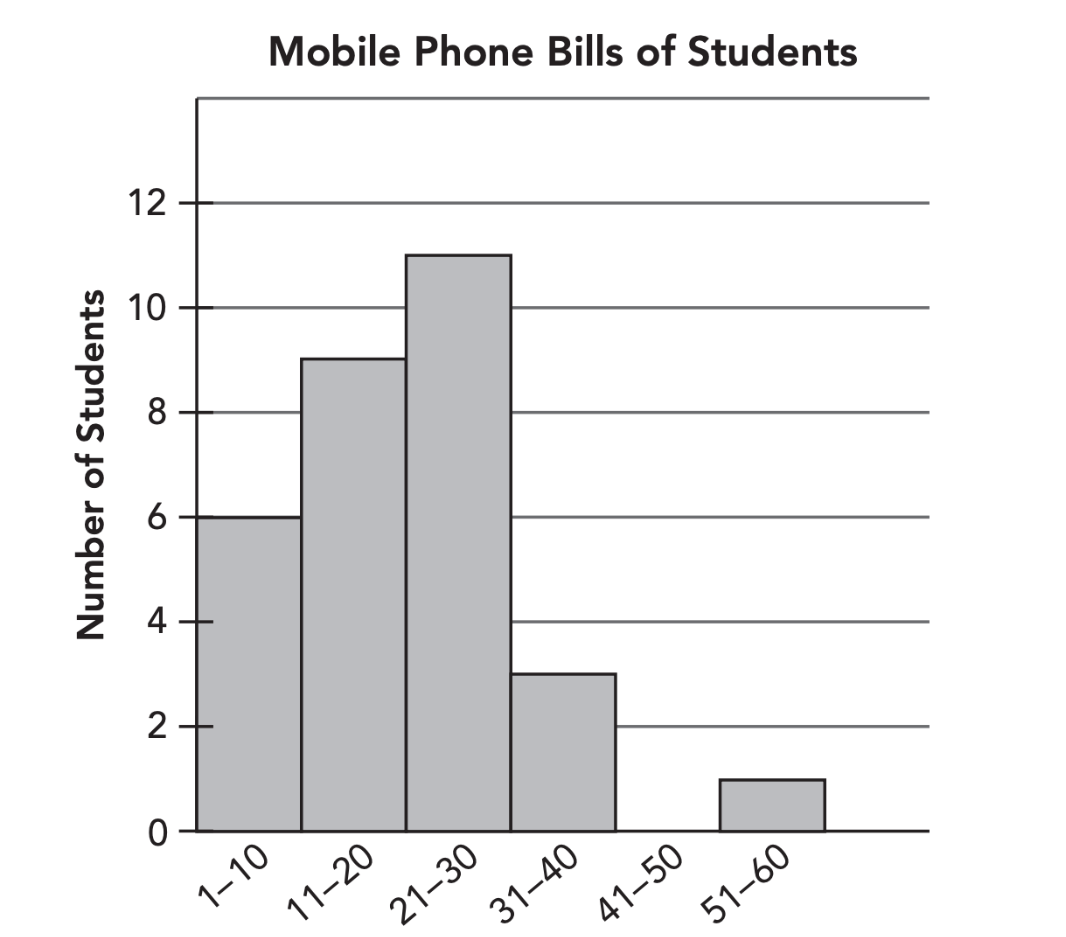
29
1-10 =6
11-20=9
21-30=11
31-40=3
6+9+11+3 =29 were less than 41
100

What is the mean of the paint orders?
Round to the hundredths place
3.43
1+1+1+1+1+2+2+2+4+5+5+6+7+10 divided by 14
48/14= 3.428 but the 8 is Big so Bump up the 2 to 3
100

The MEDIAN is the line INSIDE the box which is 6
100
How do you find the mean?
average of the data?
add all data and divide by the number of data points
100
Determine the range of the data
2, 3, 5, 7, 8, 10, 11, 11, 13, 15, 17, 18
16
Range = Highest - Lowest
Range = 18 - 2
Range = 16
200
What is the shape of the data?
Skewed right
the "TAIL" is on the right side so it is skewed right
200
What is the range of the data?

7
Range = HIGH - low
Range = 15 - 8
Range = 7
200

Steven, 3 hours
The HIGHEST number on a Box Plot is represented by the DOT to the FAR RIGHT.
Zach was 2.25 hours
Steven was 3 hours
200
Describe data that is skewed left.
The TAIL is on the LEFT of the data.
200
Find the mean of the data
4, 5, 8, 1, 2, 3, 9, 8, 7, 6, 2
5
4+5+8+1+2+3+9+8+7+6+2 divided by 11
55/11 = 5
300
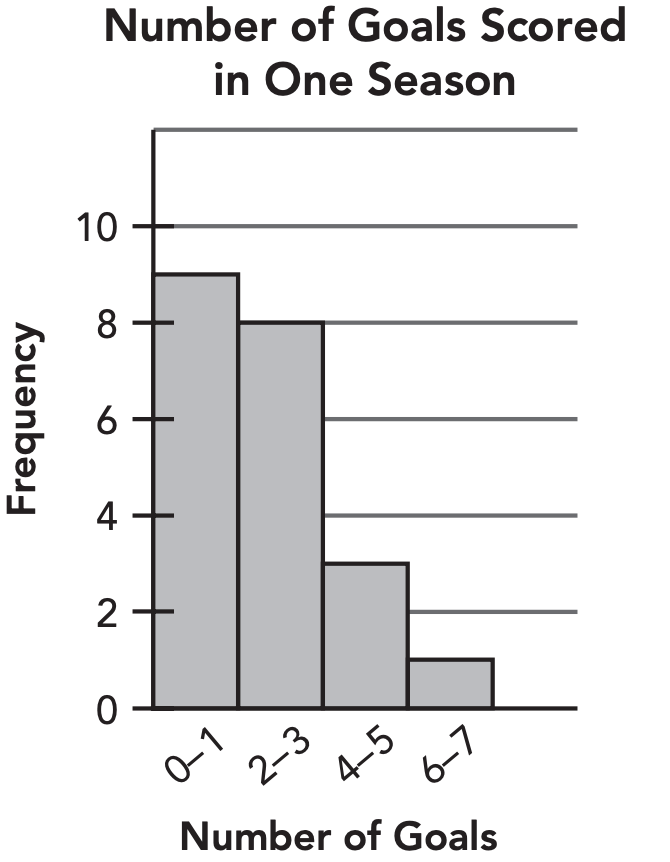
How many teachers were employed for more than 3 years?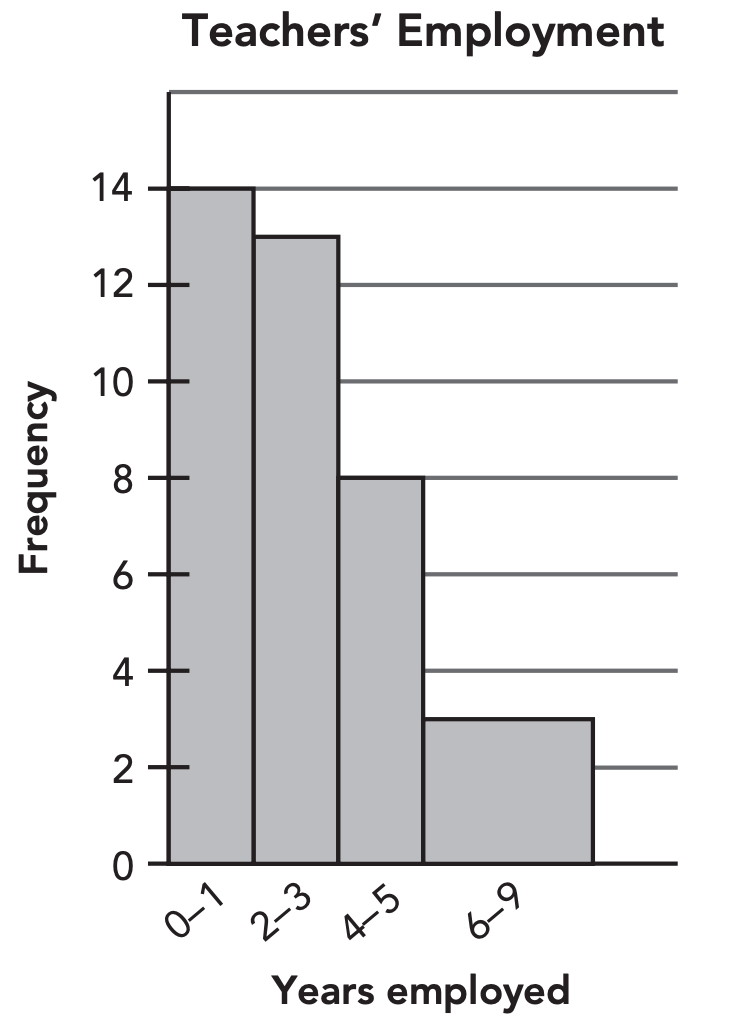
11
4-5=8
6-9=3
8+3 =11 teachers were employed for "more than 3" years
300
What is the median of the data? 
2
2 ways to find MEDIAN on a Dot plot:
write all of the scores smallest to biggest and find the MIDDLE
OR
Cross off one dot on the left and then one on the far right. Keep doing this and move to the middle.
2 would be the MEDIAN because when you move L and then R you end up with the 5 dots in the middle above 2
300
Determine the IQR
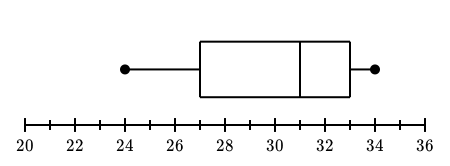
6
The IQR is the "INNER QUARTILE RANGE"
You find it by taking the far right of the box (33)
and subtract the far left of the box (27)
33-27=6
300
Which would you use to compare data that is skewed right? Mean or median
Median
If it is skewed, there is one or more OUTLIERS. Outliers can really affect the Mean. For instance, if you make a 0 on an assignment, it will lower your average (mean) significantly.
300
Find the MAD (Mean Absolute Deviation) of the data
23, 10, 11, 24, 32, 15, 13, 16
6.25
1. Find the MEAN first: 144/8=18 23+10+11+24+32+15+13+16 divided by 8
2. Find the DISTANCE of each value from the mean:
5+8+7+6+14+3+5+2 divided by 8
50/8 = 6.25
400
How many households were surveyed on their vehicle age?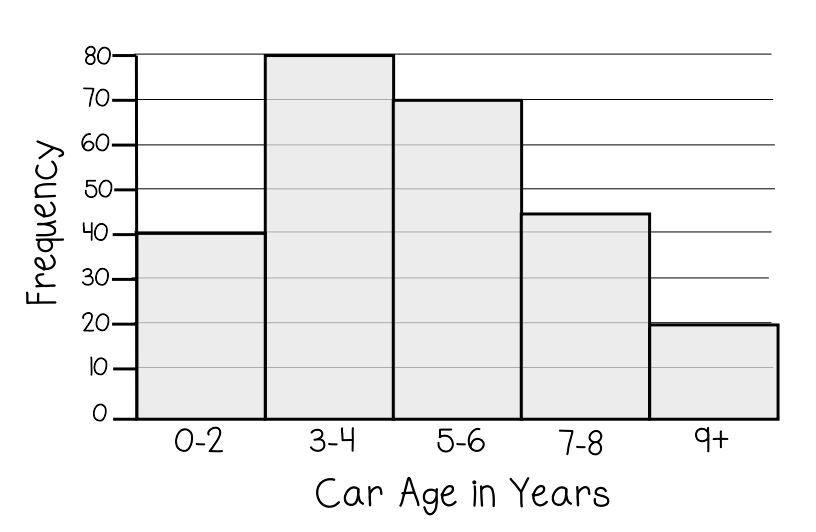
255
0-2= 40
3-4= 80
5-6= 70
7-8= 45
9+=20
40+80+70+45+20=255 people
400
 what is the shape of the data?
symmetrical
The left and right side of the tallest column of dots is almost the same so it is symmetrical.
It doesn't have a TAIL
400
What would you use to compare the temperature in Dallas? Mean or median Why?
You would have to compare the MEDIAN because Box Plots don't allow us to find the Mean. It doesn't have all of the data points. We only know 5 of the points.
400
How do you find IQR?
Q3 - Q1
(Right side of the box) - (Left side of the box)
400
Class 1: {68, 93, 53, 100, 77, 86, 91, 88, 72, 74, 66}
Class 2: {77, 91, 82, 68, 75, 72, 85, 65, 70, 79, 94}
Compare the range of both classes.
Which class had a larger range?
1: 47
2: 29
Class 1
Range = HIGHEST - lowest
Range(1) = 100-53 = 47
Range (2) = 94-65 = 29
500
If you were to compare the data in this histogram to another histogram with a similar shape would you use the mean or median? Why?

Mean because the data is symmetrical
500

Is this dot plot symmetrical or skewed? If skewed, which direction?
Skewed to the LEFT because the TAIL is to the left
500
 Which group has the lowest MEDIAN?
Group C
If you compare the INSIDE line for each of the boxes, C has the line that is furthest to the Left which is the lowest number.
500
What is the lowest point of a box plot called?
Minimum
500
Class 1: {68, 93, 53, 100, 77, 86, 91, 88, 72, 74, 66}
Class 2: {77, 91, 82, 68, 75, 72, 85, 65, 70, 79, 94}
Compare the ranges for both classes.
Which class would you think was more consistent? why
Class 2 had a lower range, so I would think that class was more consistent.
The best way to tell though is to find the MAD for both!