MMMR !!
Pop vs Samp
Inferrrrrrr
Meow
Polka Dot
100
What is the mode of the following numbers:
2, 3, 3, 4, 4, 4, 5, 5, 5, 5, 6, 6, 6, 6, 7, 7, 7, 7, 7
7
100
Scenario: determining the most popular sport among students in your middle school.
Survey: you survey all of your best friends in the 6th grade and your brother’s best friends in the 8th grade.
Representative sample or biased sample?
BIASED!
100
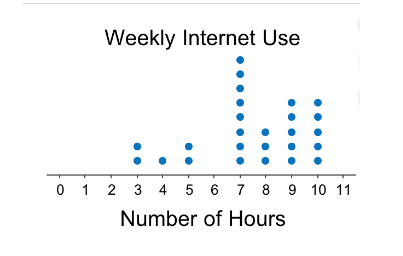
Jacob wants to convince his dad that he should be allowed to increase his weekly internet usage at home from 5 hours a week to 7 hours a week. Can Jacob use this data to present a valid inference that will convince his dad? Explain.
Yes, most students use the internet 7 or more hours in a week
100
What is the Interquartile range of this box plot? 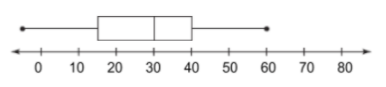
25
100
The mode of this frequency table:

What is 2?
200
What is the range of the following numbers:
12, 5, 20, 8, 2, 15, 10
18
200
Scenario: identifying the most common pizza topping selected by students in the 6th grade at your school.
What is the population?
All the 6th graders
200
A population of middle school students consists of 100 boys and 250 girls. If a representative sample from this population contains 25 girls, how many boys would be expected in this sample?
10 boys
200
What is the lower extreme? What is the upper extreme?
LE - 15
UE - 80
200
The Median of this frequency graph:
What is 2?
300
The median of this data set:
6, 4, 0, 1, 7, 2, 5, 3,
What is 3.5?
300
Scenario: identifying what the most popular sneaker brand is among all middle school students in your school.
What would be an example of a representative sample?
surveying 3 random students from each homeroom.
300
Jimmy surveyed a random sample of students at school to collect data about the number of books they read this semester. Use the data in the table to create 2 valid inferences
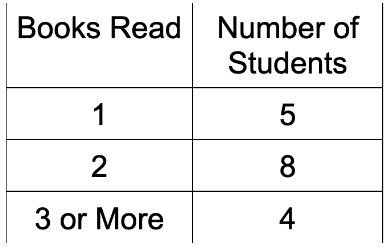
Students have read 2 books more than any other number of books
More than 10 students have read at least 2 books
300
What is the range?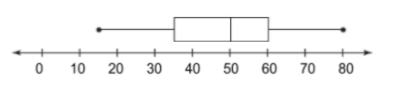
65
300
To the nearest tenth, what is the mean number of photographs taken?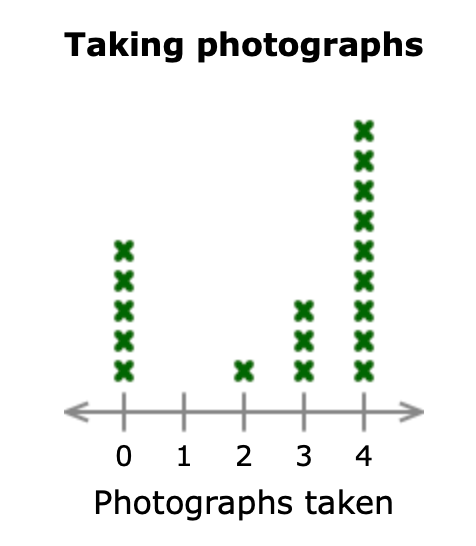
2.6 photographs
400
The mean of this data set:
3, 8, 7, 4, 9, 5
What is 6?
400
scenario: determining the most common college attended by the staff members in the high school in your town.
survey: the principal sends a link with the survey to all high school staff members, asking for everyone to complete it.
Representative sample or biased sample?
Representative sample
400
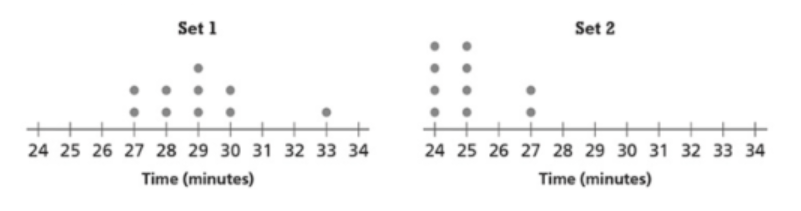
Using the Dot Plots, which set of math homework was more challenging?
Set 1
400
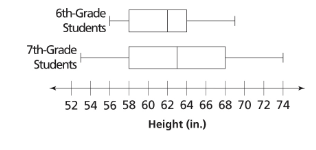
Which grade has greater variability in their heights?
7th grade has greater variability in their heights because the box is longer
400
Which data set has a greater variability? 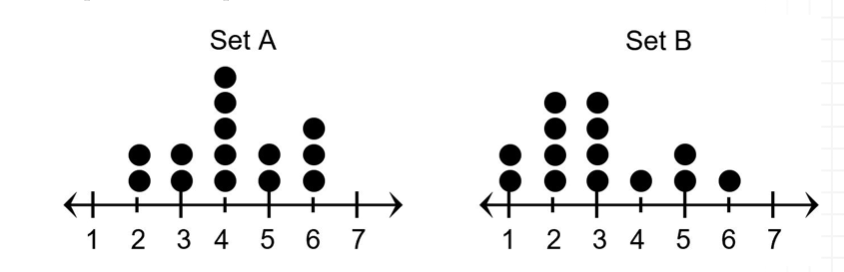
Set B (more spread out)
500
The MAD of this data set:
10, 14, 12, 8, 16
MAD = 2.4
500
An unusually rainy spring has caused some of the apricot trees at Jackson Grove to not produce fruit. The grove's owners want to know how this will affect the total crop, but checking each tree would take a long time. Instead, the owners ask each worker to randomly check 10 trees to see whether or not they are producing fruit.
What are the population and the sample of the experiment?
Population - all the apricot trees at Jackson Grove
Sample -the randomly chosen 10 trees that were checked
500
A random survey was conducted about students' favorite fruits. Ten students voted for apples, 12 students voted for oranges, and 3 students voted for bananas. Rachel concludes that 240 of the 600 students in the school are expected to prefer apples . Is her conclusion valid? Explain!!!
YES! Rachel's conclusion is valid. 10/25 can be written as 240/600
500
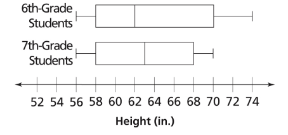
What is the IQR for both 6th and 7th grade?
6th grade: 12
7th grade: 10
500
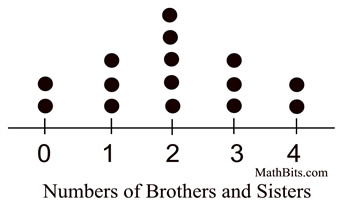
Use the means to make a comparative inference about numbers of siblings.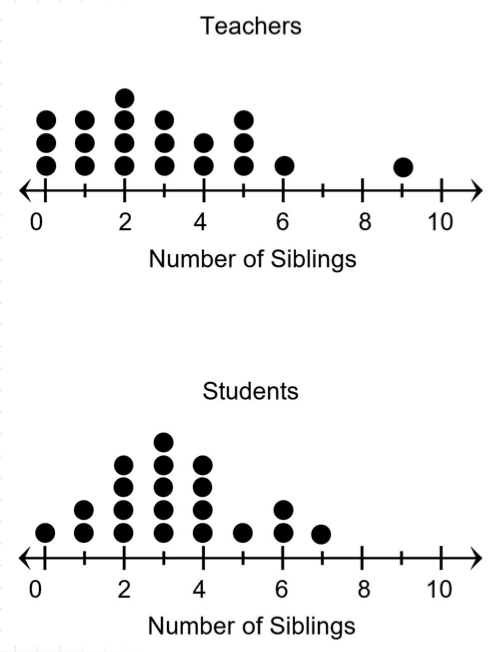
The mean of the teachers is 2.9 and the mean of the students is 3.35, so in general the students have more siblings than the teachers do.