Sample Types
MMMR
Histograms/Line Plots
Box and Whisker Plots
Samples & Populations
Using Statistics
100
What sample method was used?
Surveying the students in your math class
Convenience sample
100
Find the mean, median, mode, and range
4, 5, 2, 8, 6, 5, 5
Mean: 5
Median: 5
Mode: 5
Range: 6
100
What was the most common height?

250 - 300 cm
100
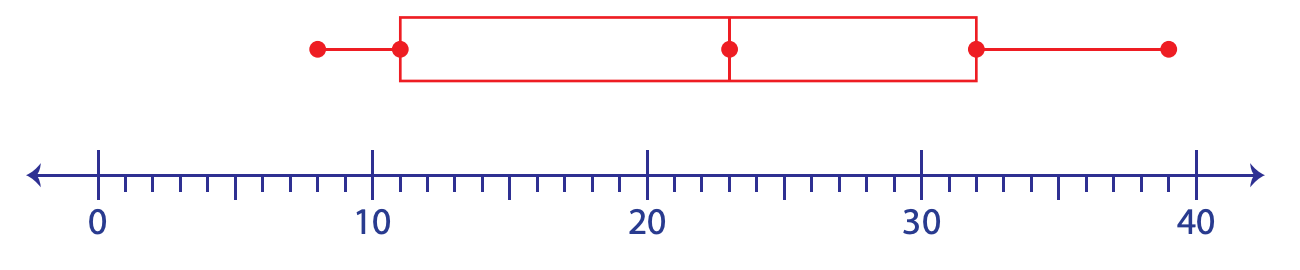
What is the median of the data set?

23
100
You want to find out about what class middle school students like. Which of the following would be the population?
a. All 8th grade students
b. All Middle school students at EMS
c. 10 kids from each class
b. All Middle school students at EMS
100
Which year had the higher mode?
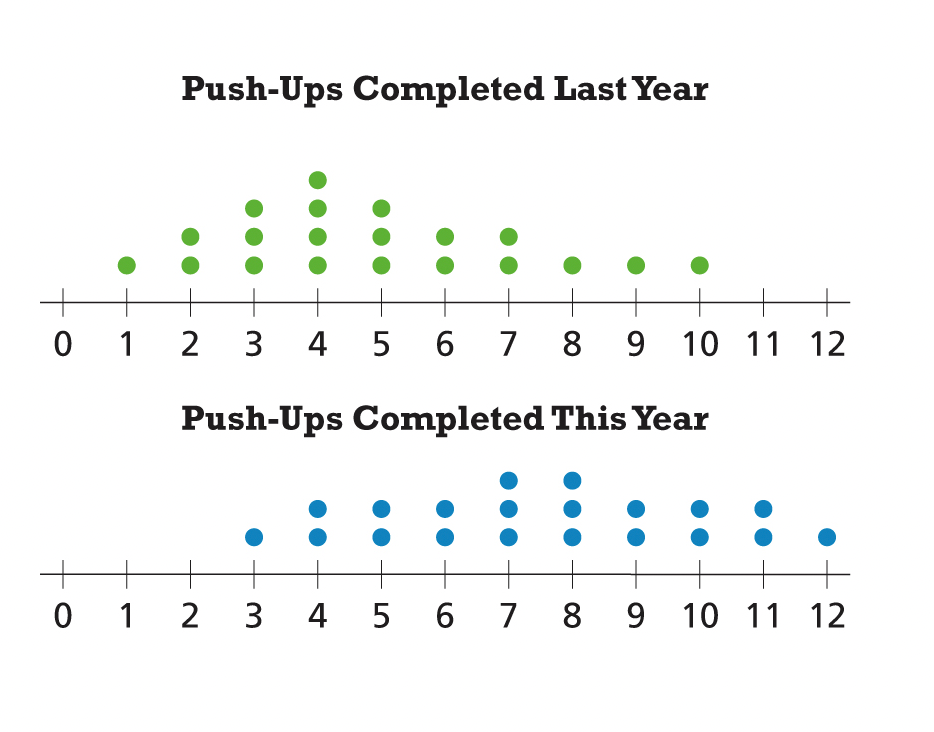
Push-ups completed this year
200
What sample method was used?
Using a spinner to select names
Random Sample
200
Find the mean, median, mode, and range
8, 4, 2, 8, 3
Mean: 5
Median: 4
Mode: 8
Range: 6
200
How many trees where less than 200cm?
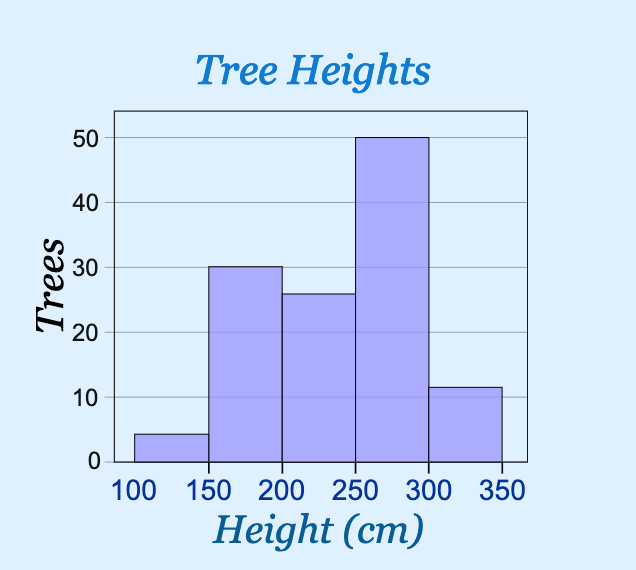
35 trees
200
What is the first quartile of the data set?

11
200
You want to find out about home prices are in your neighborhood. Which of the following would be a sample?
a. all the houses in your neighborhood
b. All the houses in your town
c. 3 houses from each street in your neighborhood
c. 3 houses from each street in your neighborhood
200
Which student's data had the smallest value (minimum)?
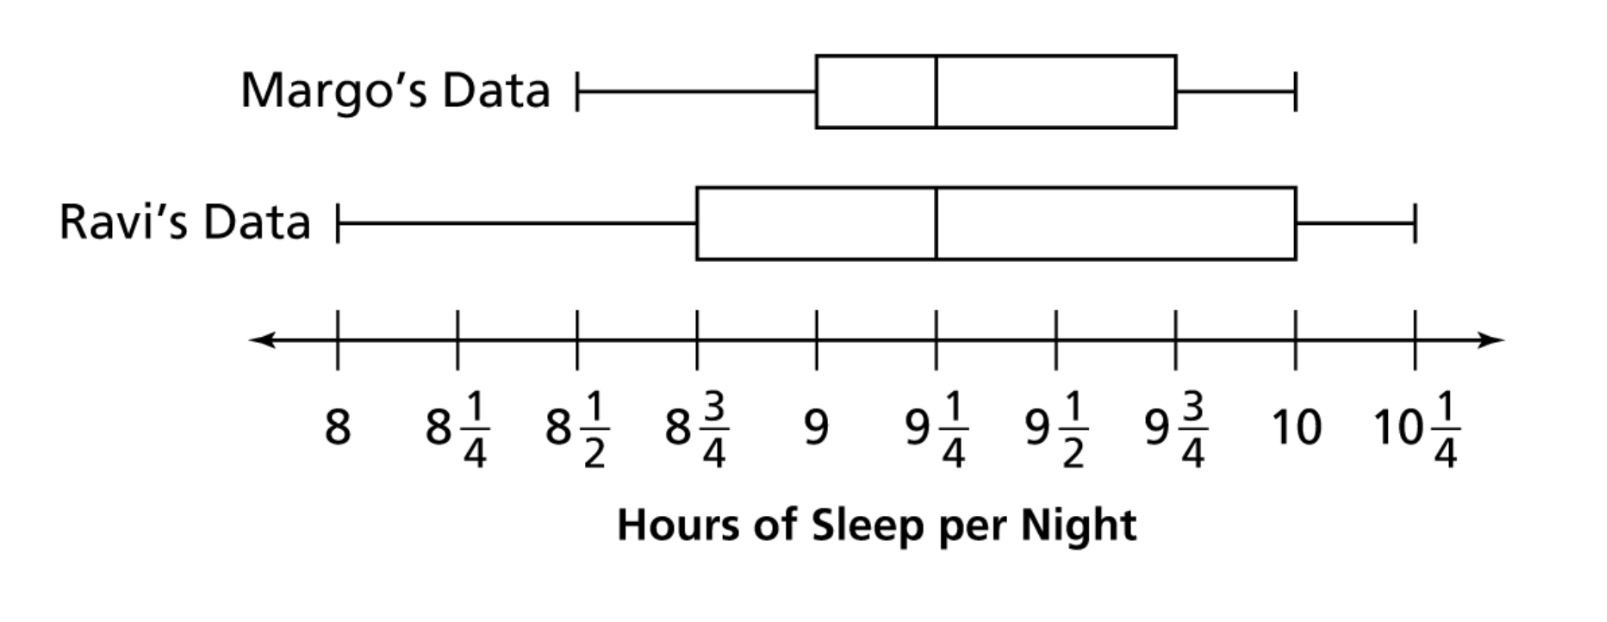
Ravi's data
300
What sample method was used?
Surveying every 10th student in the hall
Systematic Sample
300
Find the mean, median, mode, and range
4, 2, 10, 4, 8, 5
Mean: 5.5
Median: 4.5
Mode: 4
Range: 8
300
How many puppies were included in this data?
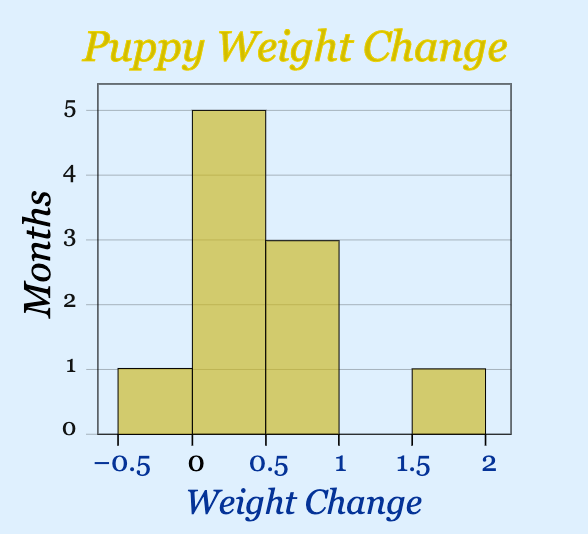
10 puppies
300
Where is the last 50% of the data located?

Between 23 and 39
300
You want to find out about where people like to shop in your town. Which of the following would be the population?
a. Everyone at the mall
b. Everyone in your town
c. Everyone at Walmart
b. Everyone in your town
300
True or False: both students data had 50% of the numbers above 9 1/4?
True
400
Would the following sample be representative or biased?
Asking every 5th student who walks into in band class if they play an instrument
Biased, all students in band class probably play an instrument
400
Find the mean, median, mode, and range
11, 15, 11, 7, 9, 10
Mean: 10.6
Median:10.5
Mode: 11
Range: 8
400
How many students ate less than 3 candy bars?
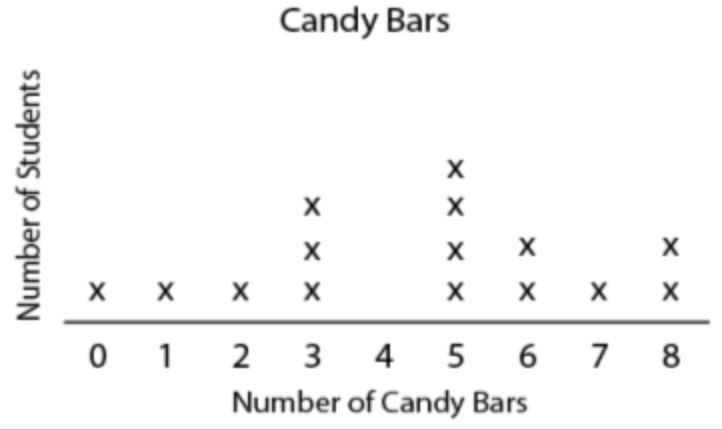
3 students
400
Where is the last 75% of the data?
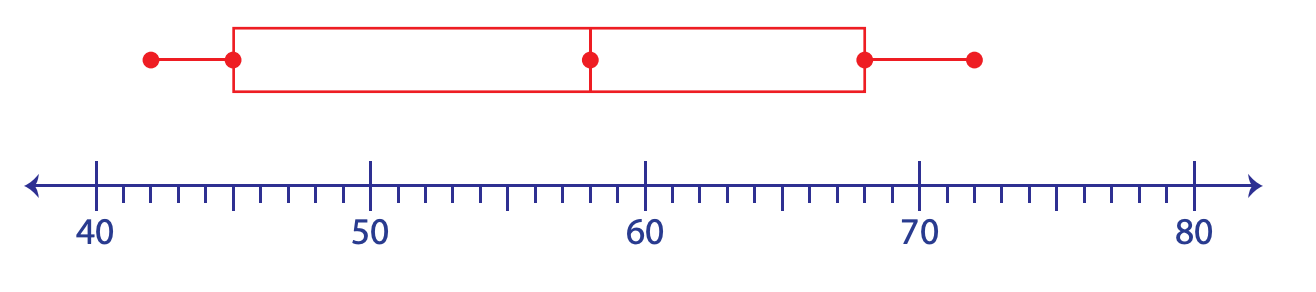
Between 45-72
400
You want to find out how many middle school students at your school play an instrument. Which of the following would be a population?
a. The students in band class
b. The students in Mrs. Seiler's class
c. All students at EMS
d. All the kids in the cafeteria
c. All students at EMS
400
Which student's data had the largest interquartile range?
Ravi's data
(The interquartile range is the range between Q1 and Q3)
500
Would the following sample be representative or biased?
Asking every 5th student who walks by in the hall if they play an instrument.
Representative
500
Find the mean, median, mode, and range
92, 90, 81, 89, 82, 85, 82, 89,
Mean: 86.3 (rounded to the nearest tenth)
Median: 87
Mode: 89 & 82
Range: 11
500
What is the mode of the data?
5 candy bars
500
Make a box and whisker plot of the data:
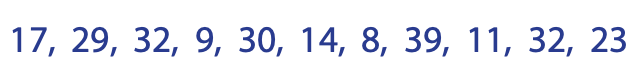
500
You want to find out how many cats people have in your town. Which of the following would be a sample?
a. The number of cats in one household
b. The number of cats in every other household
c. All the cats in each house in town
d. The number of cats in all households of a neighborhood
Samples:
a. The number of cats in one household
b. The number of cats in every other household
d. The number of cats in all households of a neighborhood
500
Which year had the highest variability (range)?
Neither, the range is the same for both, 9