Organize Data Into Three Categories
Collect and Represent Data
Make Sense and Persevere
100
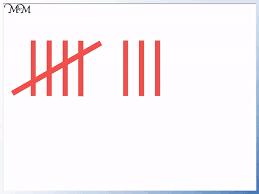
Represent 8 into Tally Marks.
100
Draw an appropriate pictograph/ graph to represent the data.
Corn Corn
Peas Corn
Peas Peas
Corn Peas
Peas Corn
Corn Corn
7-corn
5-Peas
100

How many children chose Red?
How many children chose Orange?
How many children chose Yellow?
How many children chose Green?
How many children chose Light Blue?
How many children chose Dark Blue?
How many children chose Purple?
Red-4
Orange-1
Yellow-2
Green-3
Light Blue-5
Dark Blue-2
Purple-3
200


Using Tally Marks Represent how many red, blue, green, and purple Santa hats.
200
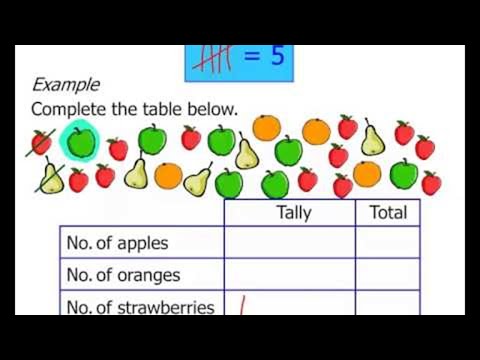 Complete the chart with Tally Marks and the total of each fruit, then the total amount of all the fruit.
Apples-7
Oranges-4
Strawberries-12
Pears-5
Total number of fruit: 28
200

How many students have blue eyes?
How many students have green eyes?
How many students have brown eyes?
Blue-8
Green-4
Brown-9
300
In Saul's closet, he has:
7 Shirts ![]()
![]()
![]()
![]()
![]()
![]()
![]()
4 Shorts 
2 Shoes 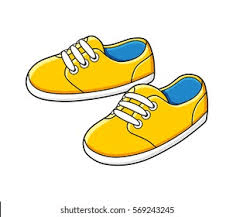
Represent these amounts using Tally Marks.
300

How many students voted for each subject?
How many students voted in all?
Math-8
Reading-6
Social Studies-3
The amount of students that voted-17
300
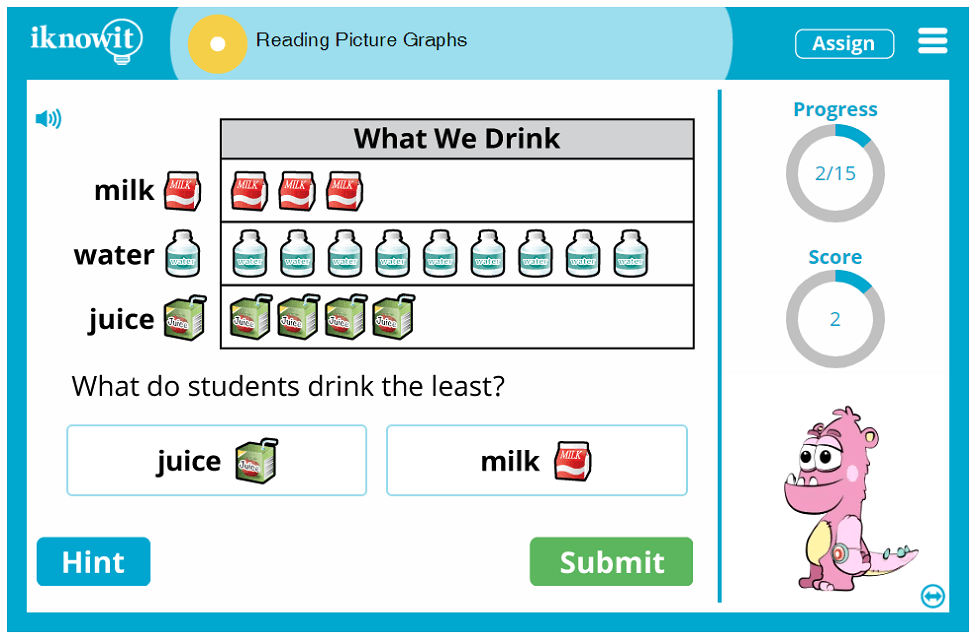
Students were asked what their favorite drink is at lunch, milk, water, and Juice.
How many students voted for milk?
How many for water?
How many for Jjuice?
Milk-3
Water-9
Juice-4
400
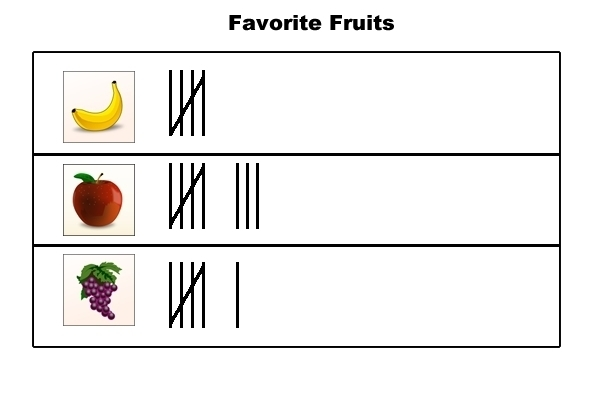
How many students voted for each fruit, and how many students voted in all?
Banana-5
Apple-8
Grapes-6
Total-19
400
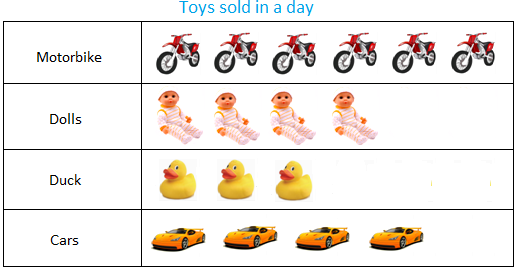
How many more bikes were sold than rubber ducks?
How many fewer dolls were sold than bikes?
How many more dolls were sold than rubber ducks?
How many more bikes were sold than rubber ducks? 3
How many fewer dolls were sold than bikes?
2
How many more dolls were sold than rubber ducks?
1
400
Kelly asks 12 students if they like using pens, markers, or pencils best. The tally chart shows their responses. How many students would need to change their vote from markers to pencils to make pencils the favorite? Complete the new chart to explain.

I know it's 3 students needed to change their vote from markers to pencils.
500

How many of each animal is reported in the zoo?
How many animals in all?
Tigers-15
Giraffes-7
Elephants-7
Deer-11
Animals in all-40
500

How many more people liked chocolate ice cream than peach ice cream?
How many fewer people liked vanilla ice cream than strawberry ice cream?
How many people voted in the survey?
How many more people liked chocolate ice cream than peach ice cream? 6
How many fewer people liked vanilla ice cream than strawberry ice cream? 2
How many people voted in the survey? 20
500
Beth asks 16 friends if their favorite color is red, blue, or green.
7 friends say red. 4 friends say green.
How many students like blue?

- A.5
- B.6
- C.7
- D.8
5