collecting data methods
Reading a box plot
Create a box plot
100
What data collecting method is...
Watching birds interact in nature and recording the interactions
(survey, observation, measurement, experiment)
observation
100
What percent of the data is below 45?
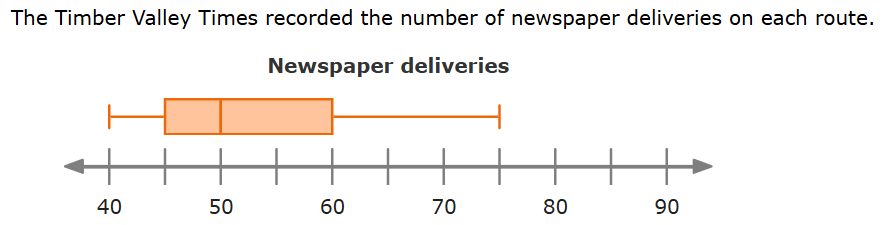
25%
100
Find the median of the data :
18, 20, 16, 14, 22, 24
14, 16, 18, 20, 22, 24
median = 19
200
What data collecting method is...
Asking people at lunch their favorite soda.
(survey, observation, measurement, experiment)
survey
200
What is the range?
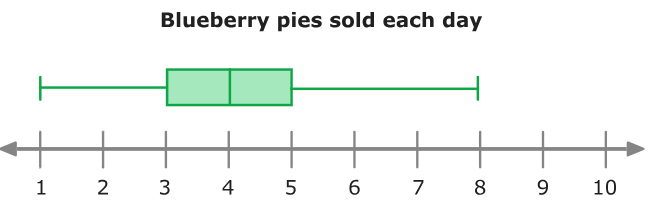
7
200
Find the lower quartile of the data:
9, 11, 10, 12, 18, 8, 6, 14, 16
6, 8, 9, 10, 11, 12, 14, 16, 18
LQ: 8.5
300
What data collecting method is...
Testing the impact of heat on a chemical.
(survey, observation, measurement, experiment)
Experiment
300
What is the interquartile range?
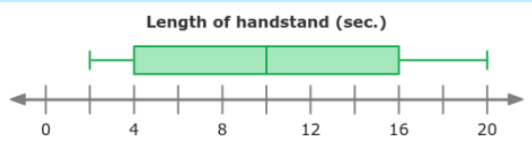
12
300
Find the range:
56, 45, 31, 65, 48, 60, 53, 62
65 - 31 = 34
400
What data collecting method is...
Weighing yourself on a scale every morning and recording the weight
(survey, observation, measurement, experiment)
measurement
400
What percent of the class earned at least an 85?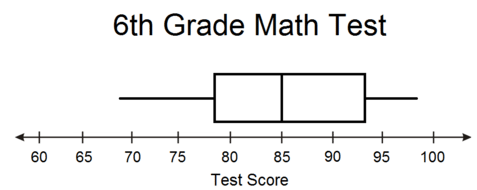
50%
400
Find the upper quartile:
78, 99, 100, 65, 63, 45, 72, 79
45, 63, 65, 72, 78, 79, 99, 100
UQ: 89
500
the Virginia Department of Transportation records how many cars come to a complete stop at an intersection.
Which data collection method did they use?
Observation
500
The mile times at the start of the track season and the mile times at the end of track season are graphed below:
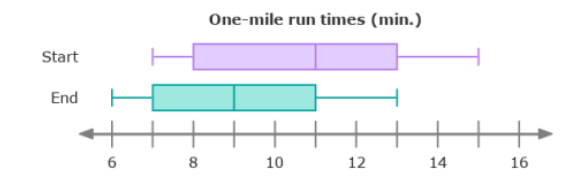
Which one has a larger interquartile range? Start or End?
Start
500
Find the interquartile range:
8, 6, 12, 18, 8, 10, 14, 9, 13, 15
6, 8, 8, 9, 10, 12, 13, 14, 15, 18
UQ: 14
LQ: 8
IQR: 6