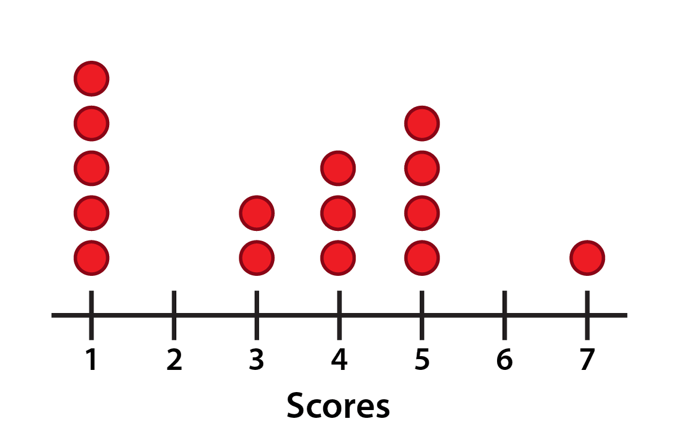
Dot Plots
Frequency Table
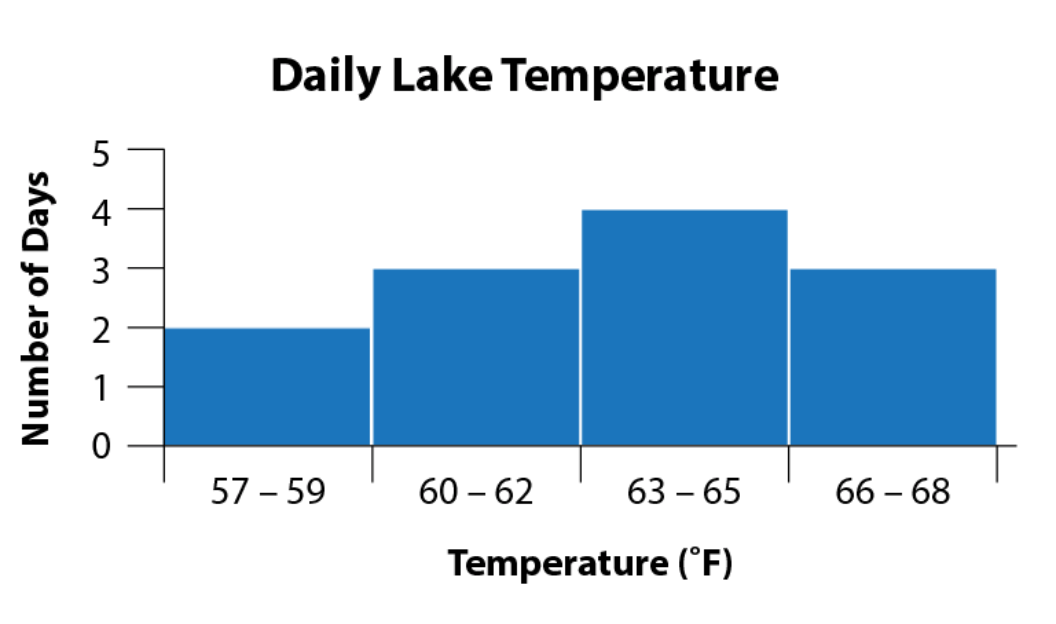
Histogram
All About Graphs
Random Math!
100
Which number has the highest frequency?
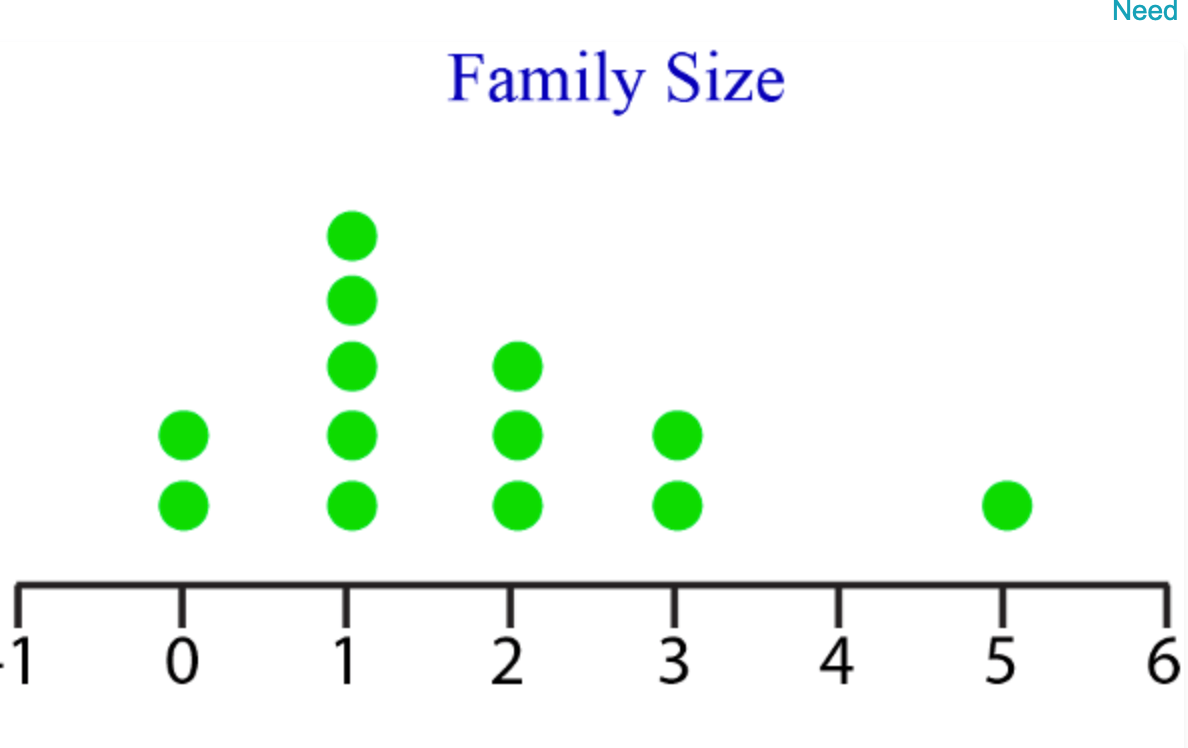
1
100
2
100
What type of graph is this?
Histogram
100
Which axis is horizontal?
x-axis
100
How do you find the area of a parallelogram?
Area = base * height
or length * width
200
How many basketball players are included on the dot plot?
15
200
What is frequency?
The number of times a value appears in a data set
200
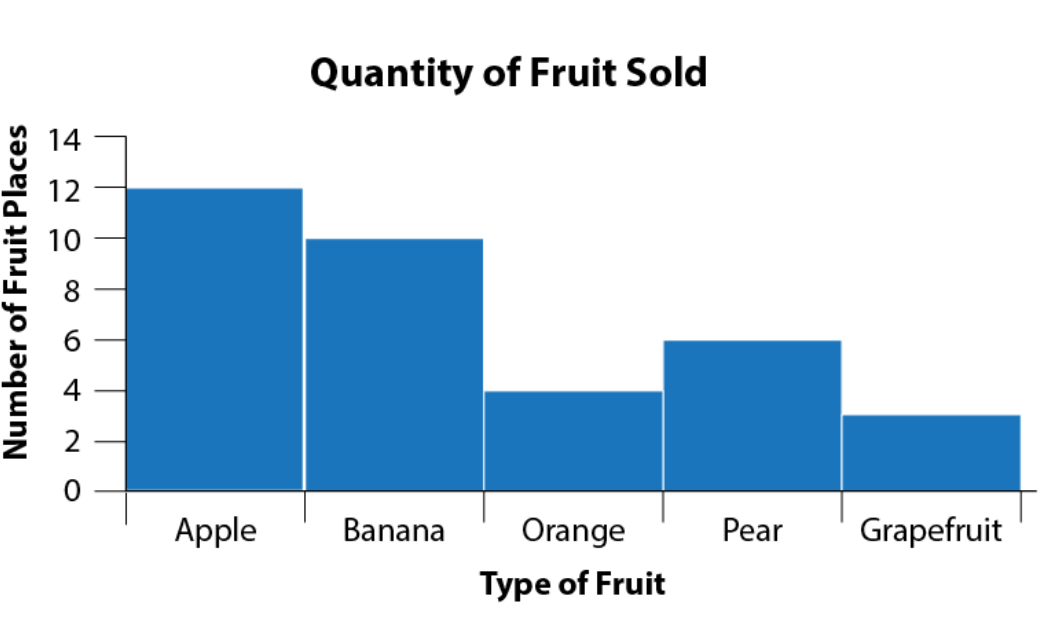
Which fruit had the highest frequency?
Apples
200
What is the "median" of a data set?
The middle value of a data set
200
Simplify the ratio 12:3.
4:1
300
How many children ate fewer than 2 slices of pizza?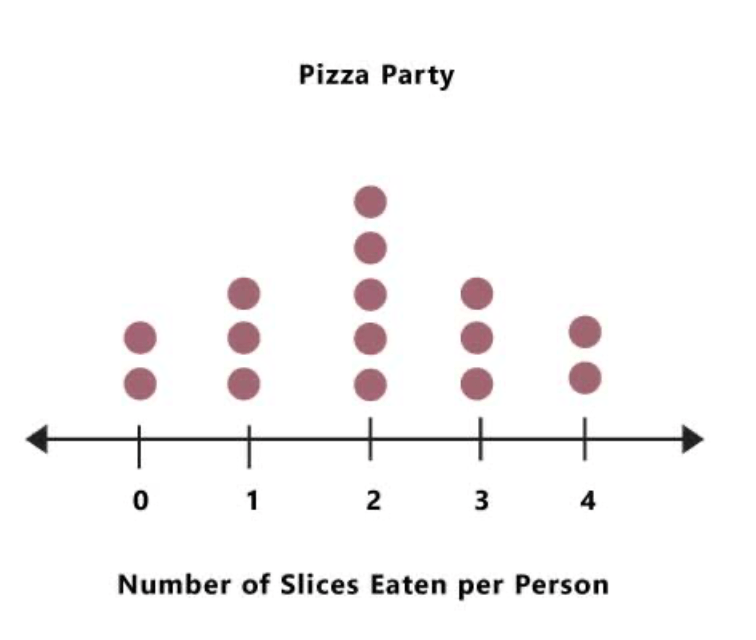
5
300
What is the word for the number that occurs most frequently in a data set?
Hint: m _ _ _
mode
300
What type of data (categorical or numerical) can a histogram represent?
numerical
300
Why is this graph misleading?
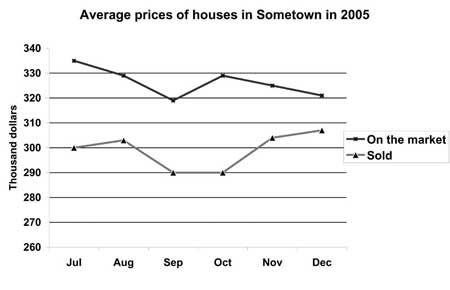
Because the scale used in y (thousand of dollars) does not start on 0, or does not use the symbol to start in 260.
300
What is 40% of 10?
4
400
A dot plot is a data distribution that uses dots to show the frequency of the values that occur within a data set. Each dot on the number line represents _____.
A. an observation about the set
B. a category of the set
C. the frequency of the set
D. a value in the set
D. A value in the set
400
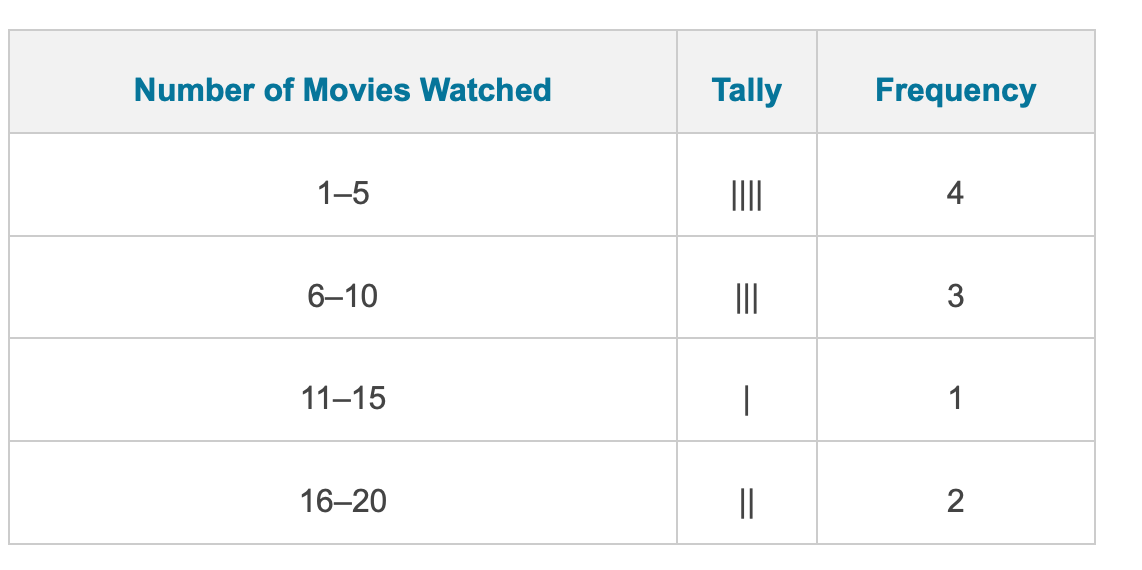
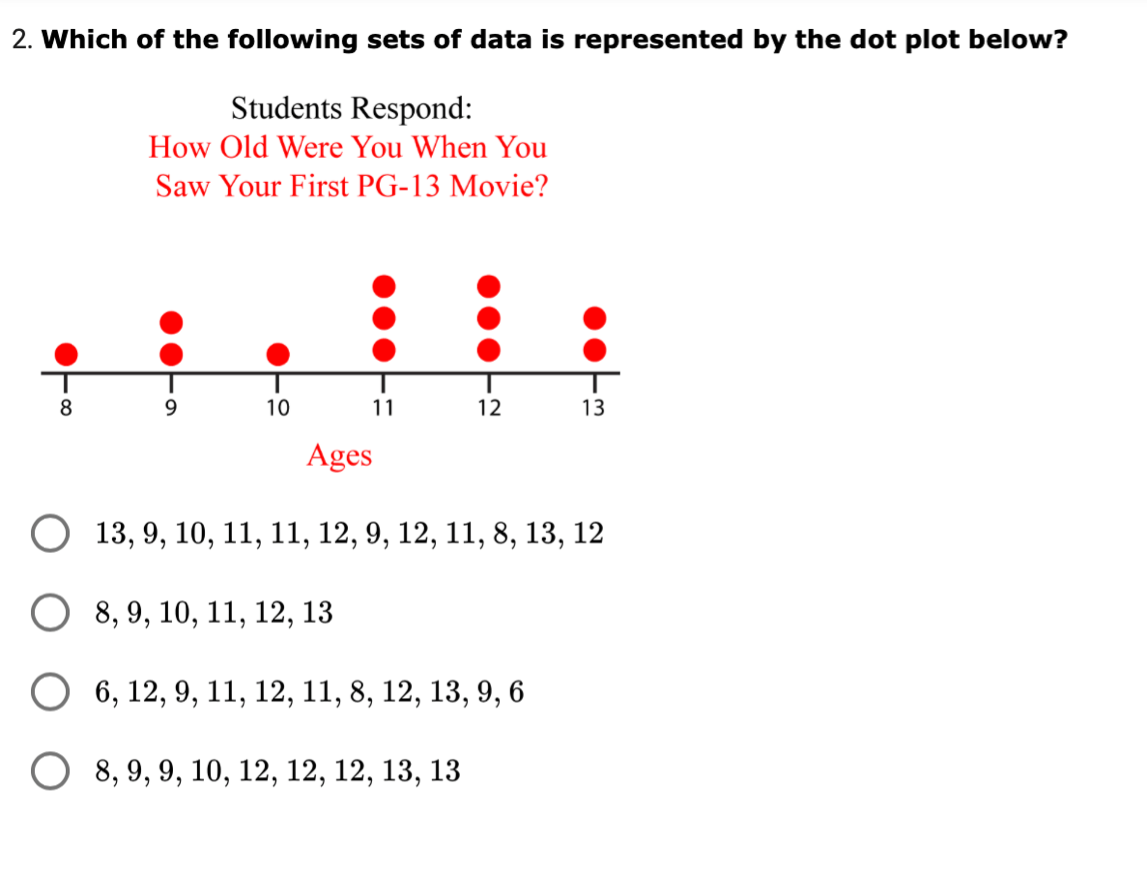
How many people watched at least 11 movies movies?
3
400
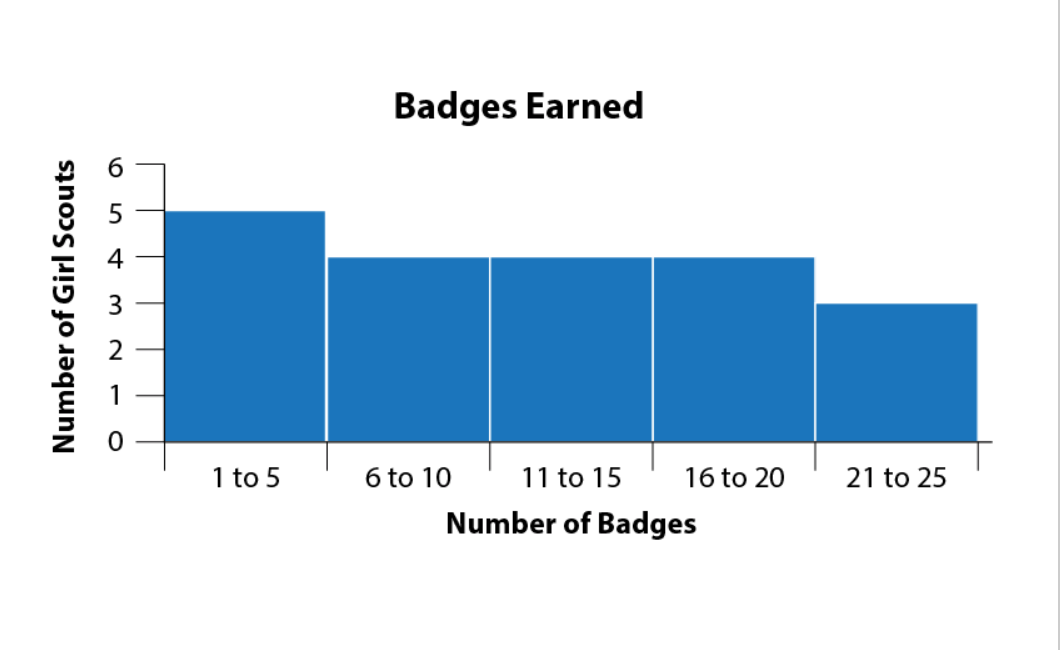
How many total badges were earned?
20
400
What type of graph can be used to represent categorical data?
bar graph, circle graph, or dot plot
400
What is the value of 122?
144
500
A
500
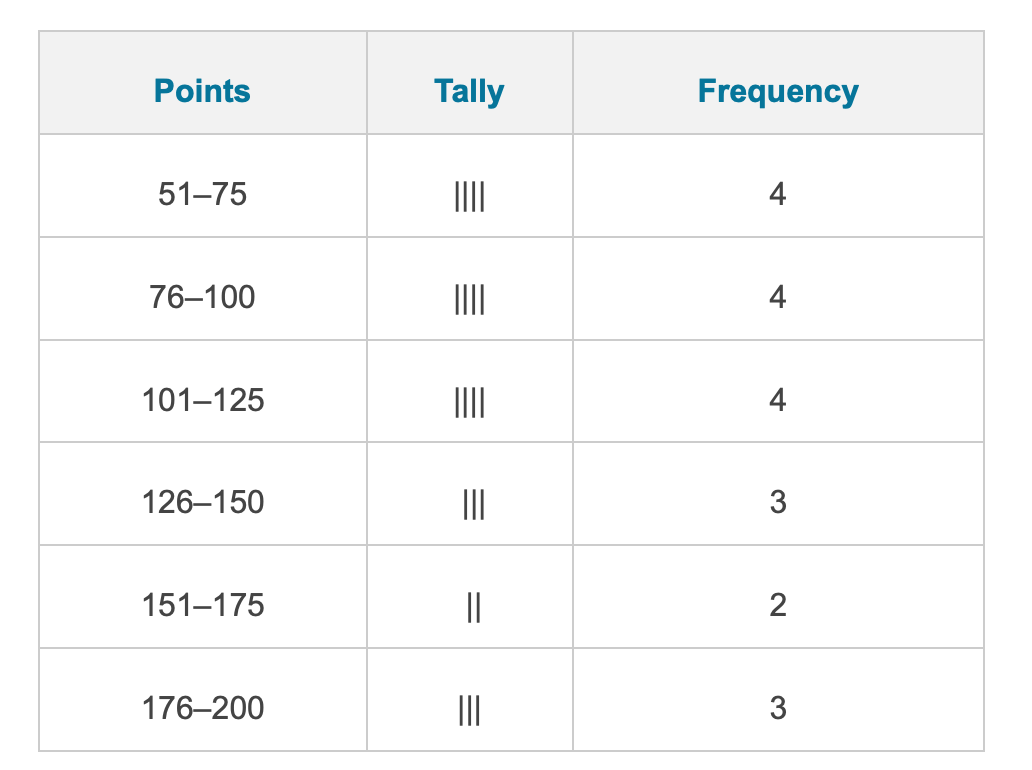
What type of graph is best to represent data that is grouped in ranges like this?
histogram
500
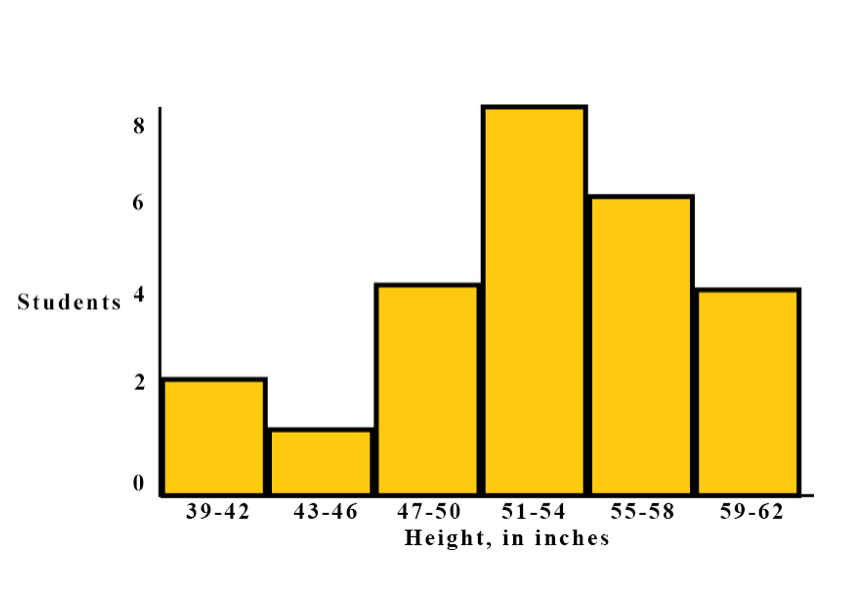
Which height range bucket had 6 students?
55-58 inches
500
The number line used on the x-axis or y-axis to count your data is called ___
Hint: s _ _ _ _
scale
500
What is the greatest common factor of 16 and 18?
2
(Greatest common factor is the largest number that goes in to 16 and 18)