Dot Plots
Mixed
Histogram
Box & Whisker Plot
Mean, Median, Mode, Range
100
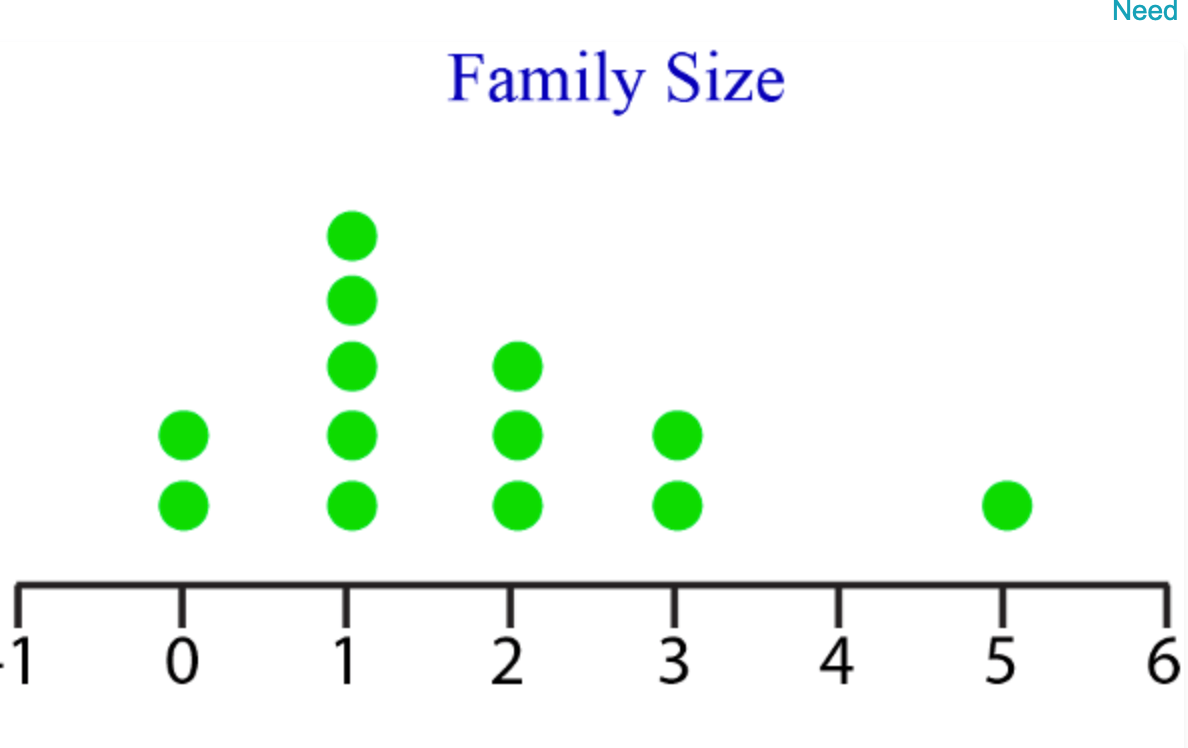
Which number has the highest frequency and what is the skew?
1 and skewed right
100
Eleven members of a family posed for a photo. Their ages were 35, 3, 63, 61, 5, 5, 5, 39, 35, 37, and 32
How many members were at least 35?
a. 4
b. 6
c. 2
d. 7
6
100
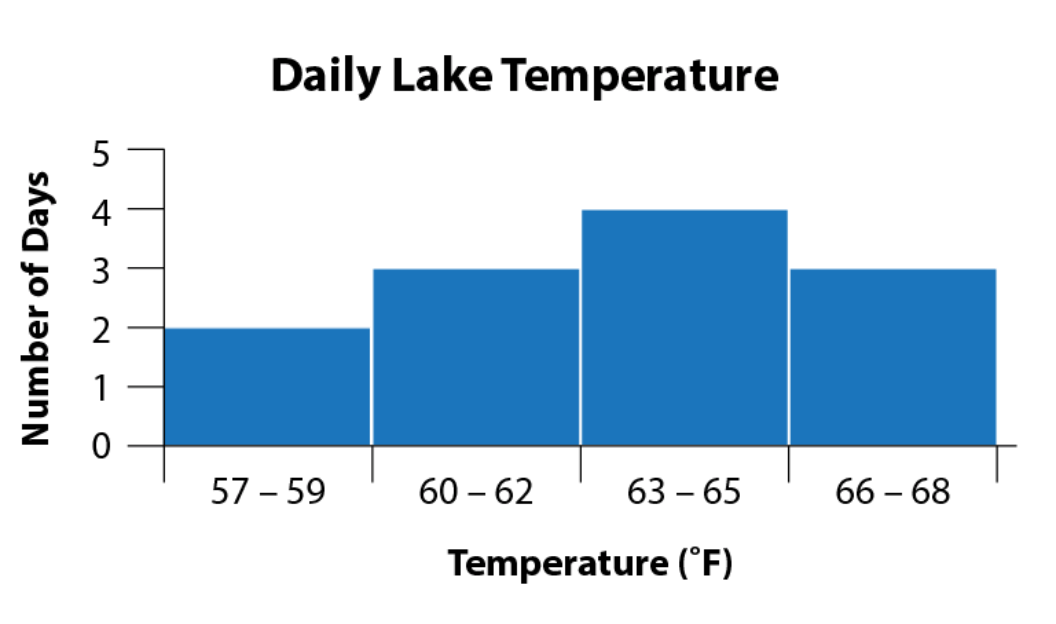
What makes this a histogram and not a bar graph?
Histograms use "intervals" or a range of numbers for the bars, bar graphs just use one amount for each bar.
100
Does a box & whisker plot display data in groups, or by each individual piece of data?
In groups, or quartiles.
100
Mean, Median, and Mode are the three measures of.....
Center
200
How many basketball players are included on the dot plot?
15
200
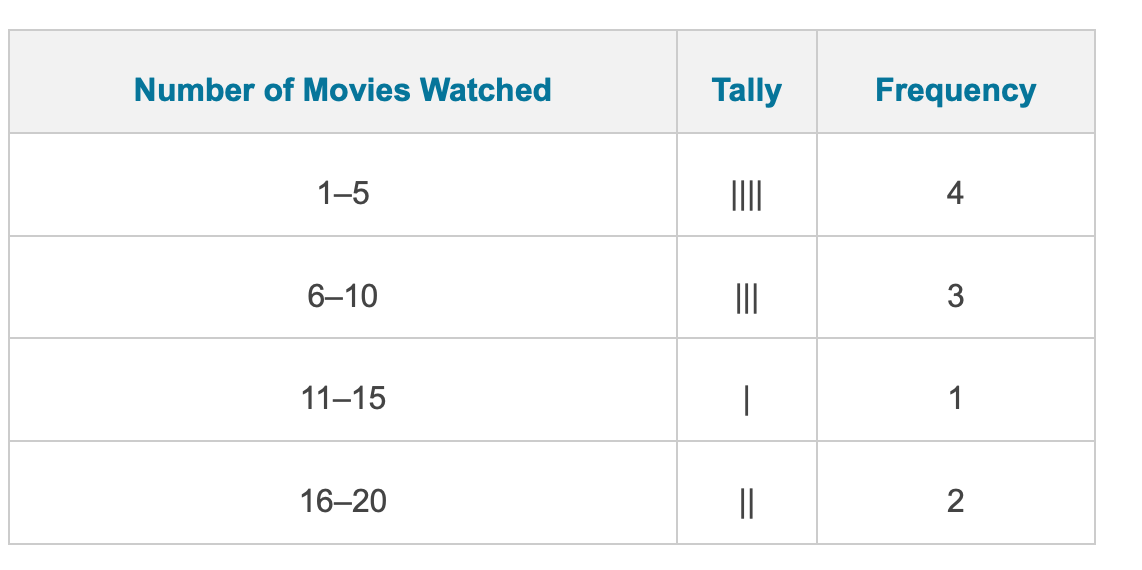 How many people watched less than 16 movies?
8
200
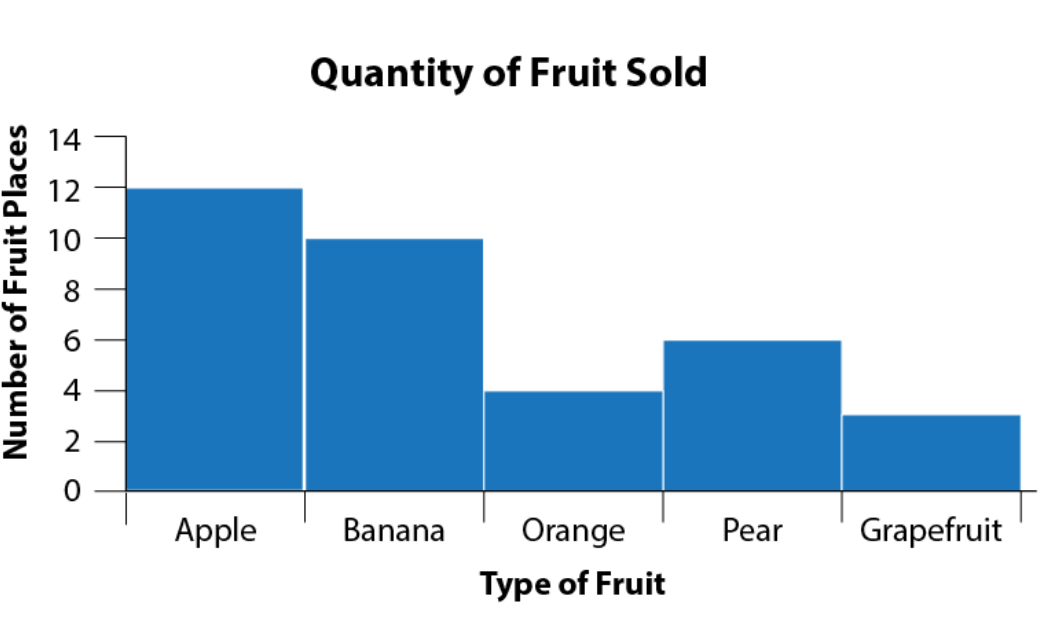
What's the difference in frequency between the 2 highest total fruits and the 3 lowest?
(12 + 10) - (4 + 6 + 3) =
22 - 13 =
9
200
What is the order of the five number summary (as you would make a box & whisker plot) from left to right?
minimum value, lower quartile (Q1), median, upper quartile (Q3), maximum value
200
What is the mean of the data set?
25,23,26,26,20
24
300
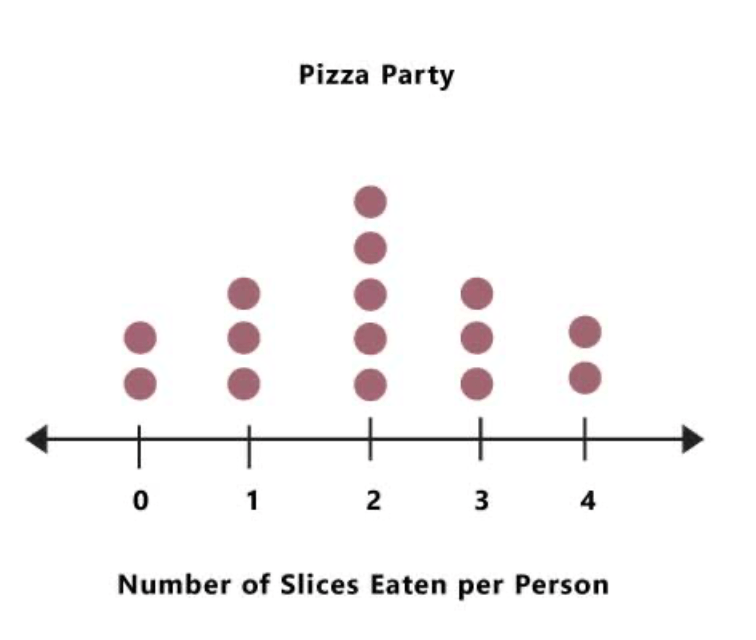
How many children ate fewer than 2 slices of pizza?
5
300
What's the most appropriate measure of center for graph that is skewed right?
What is the most appropriate measure of center for graph that is symmetrical?
Skewed right: median
Symmetrical: mean or median
300

Can you find the range AND the interquartile range of the data? If so, find them. If not, explain why not.
No. You only know what interval the data is in. You do not know the specific data points. For all we know in the 0-20 range the 2 data points could both be 20, thus making the range inaccurate.
300
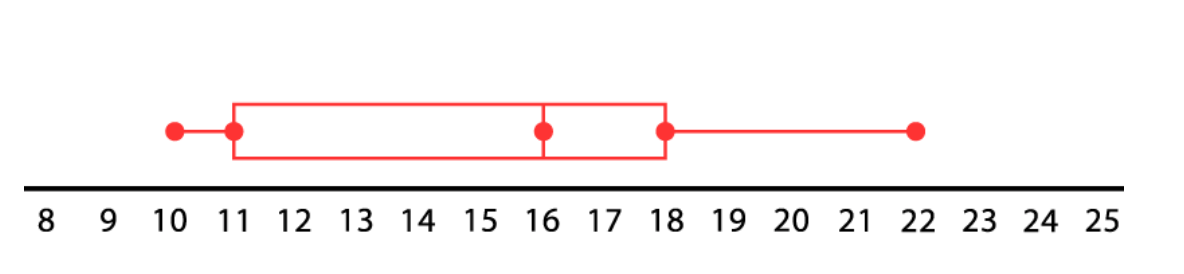
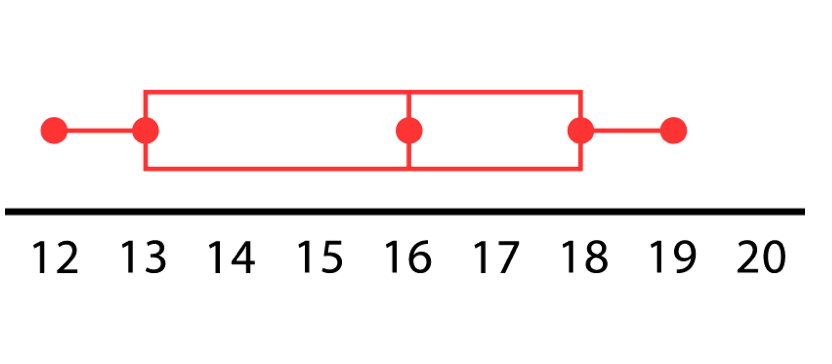
What is the 3rd quartile of this data set by looking at the box plot?
18
300
Determine the mode from the data set.
26, 35, 23, 27, 19, 23, 44, 19, 23, 23, 26, 27, 35, 26
23
400
 What percent of people ate no more than 2 slices?
66%
400
Which company's spread of number of stocks sold is the greatest? In that company, which quartile has the greatest range? What percent of the data does the IQR display?

Company B
2nd
50%
400
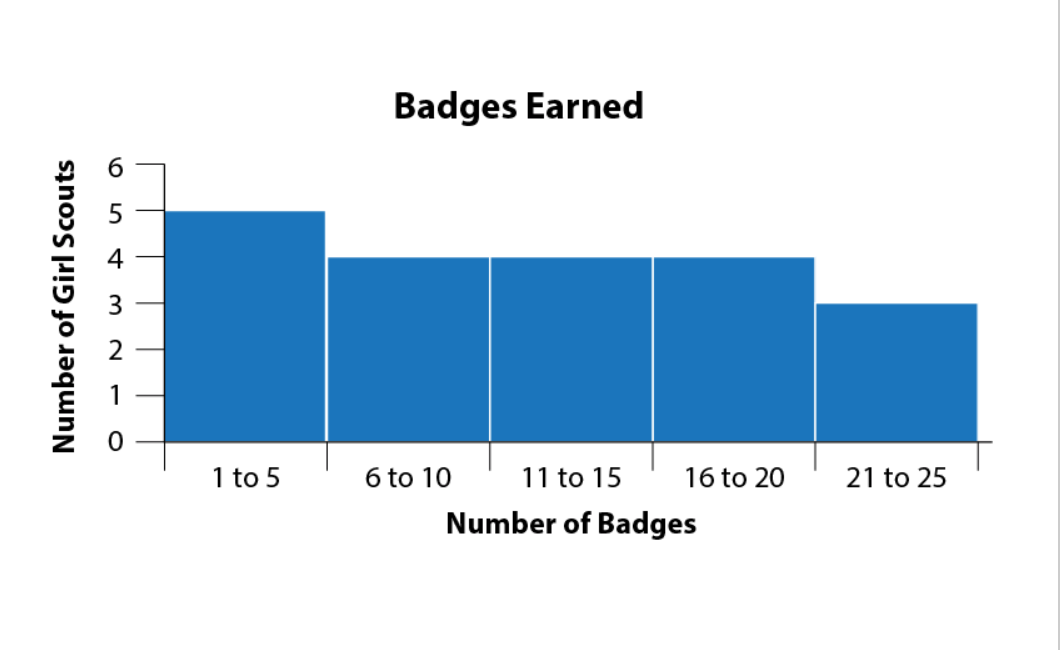
How many total badges were earned and on average how many girl scouts would be in each interval?
Total badges: 20
Average # Girls Scouts/Interval: 4
400
What is the IQR of this data set?
5
400

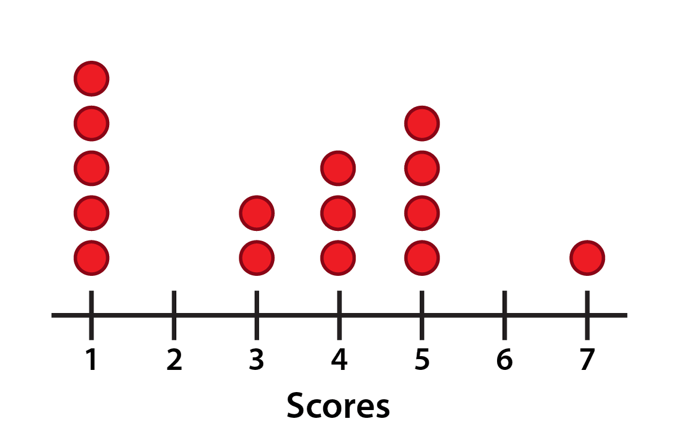
What is the median Score?
4
500
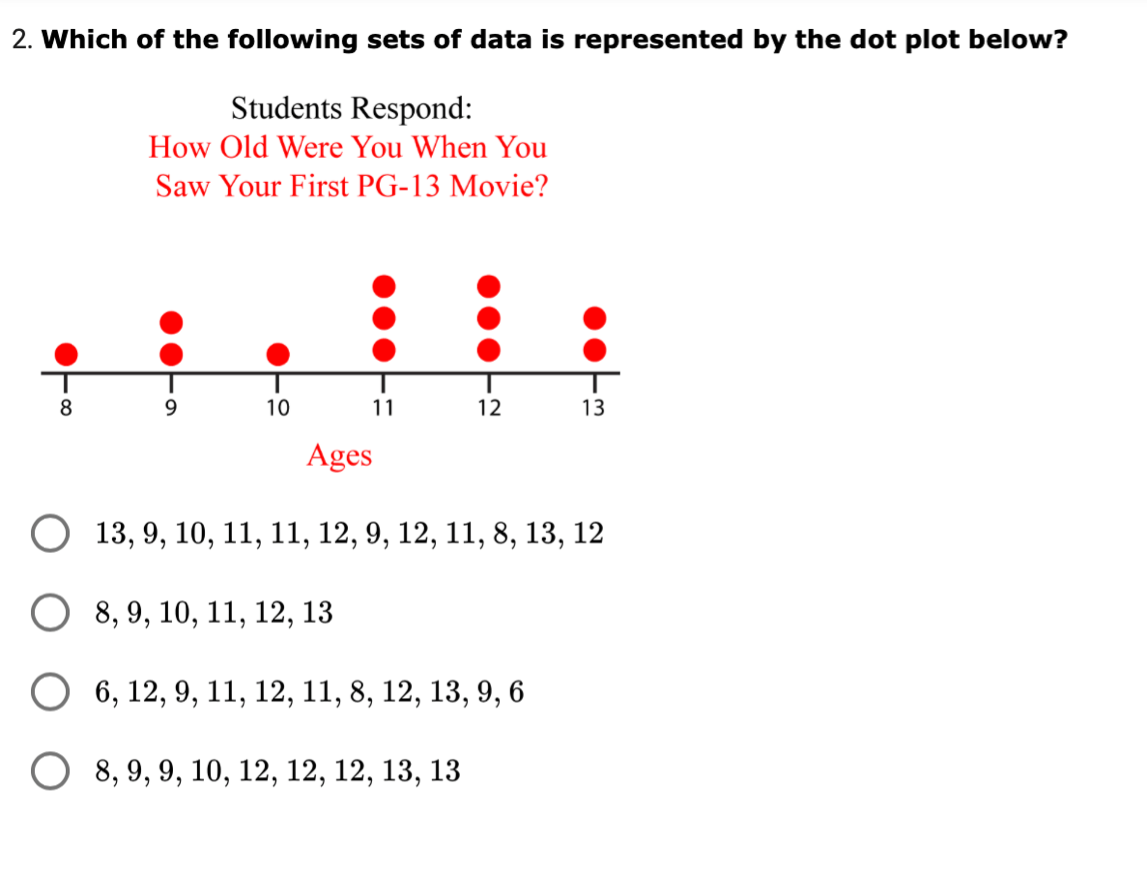
AND What percent of students saw their first PG-13 movie when they were less than 11 years old?
A
33%
500
Find the mean of the data. Round to the nearest whole number. NO CALCULATORS!

Sum total= 329
329/12 = 27.4...
27
500
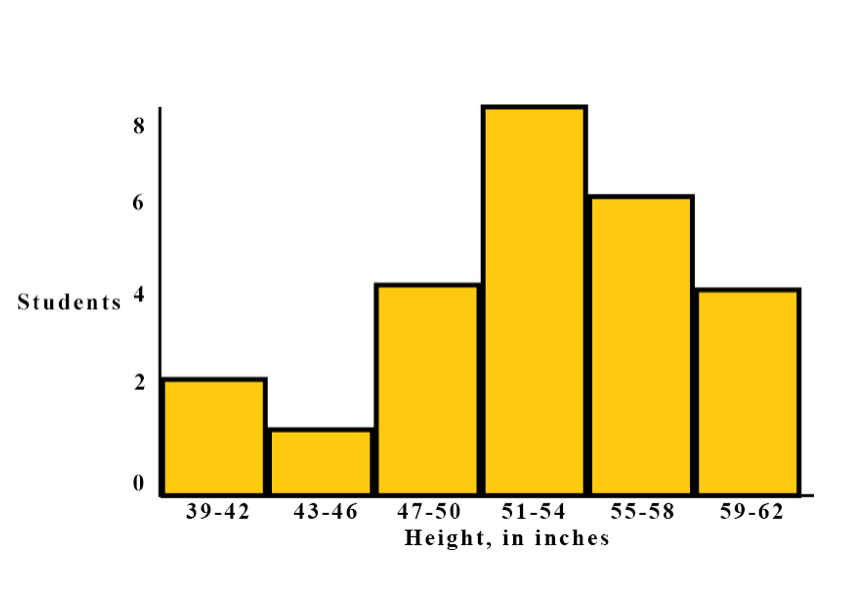
What percent of people measured between 47-58 inches tall? Write as both a fraction and a percent.
18/25= 72%
500
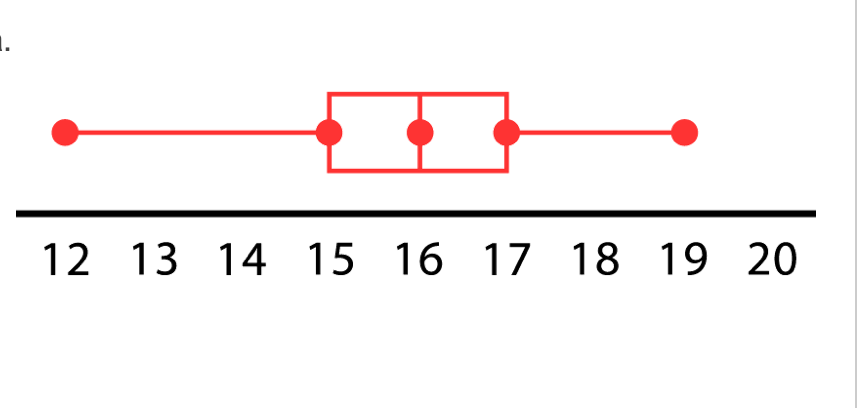
What % of the data set is equal to or greater than 15?
75%
500
What is the mean, median, and range of the following data?
27, 48, 35, 25, 31, 44, 56, 49, 48, 52, 33, and 38
Mean= 40.5
Range= 31
Median= 41 If you said 50 for median, you did not order least to greatest :)