Round Stuff
Assorted
Range
Measures of Center
Studio Ghibli Trivia
100
How many students are taking all three classes?
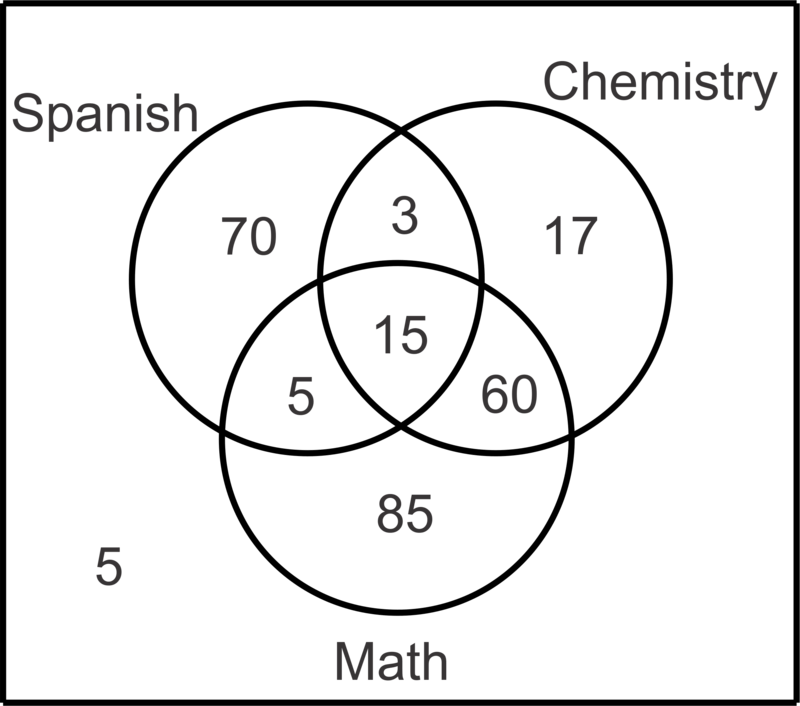
15 students are taking all three classes.
100
What is the maximum possible value?

The maximum possible value is 80.
100
What is the interquartile range (IQR) of the data represented by this box and whisker plot?

The IQR is 6.

100
What is the mode of the data represented in the stem-and-leaf plot?
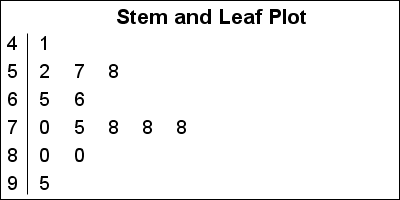
The mode is 78
100
In Kiki's Delivery Service, what is the name of Kiki's cat?
Kiki's cat is named Jiji.
200
What percentage of students got below a B?

42.8% of the students scored below a B.
200
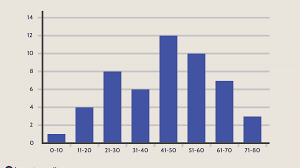
How many points of data fall between 11 and 30?

12 points of data fall between 11 and 30.
200
What is the range of the data?
The range of the data is 54.
200
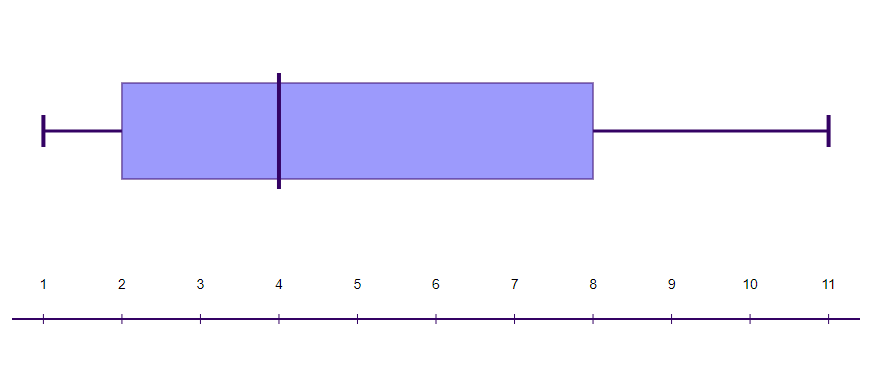
What is the median of the data represented by this box and whisker plot?

The median is 4.

200
In Nausicaa of the Valley of the Wind, what is the name of Nausicaa's pet?
Nausicaa's pet's name is Teto.
300
Based on this piechart/circle graph, what percent of the vegetables are either carrots OR tomatoes?
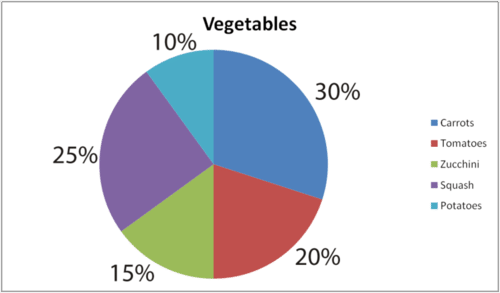
50% of the vegetables are either carrots or tomatoes.
300
How many times was the temperature under 30 degrees?
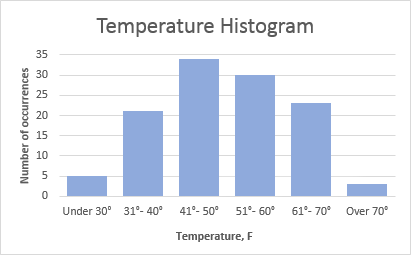
The temperature was under 30 degrees 5 times.
300
What is the range of the data represented by this stem-and-leaf plot?

The range of the data is 32.
300
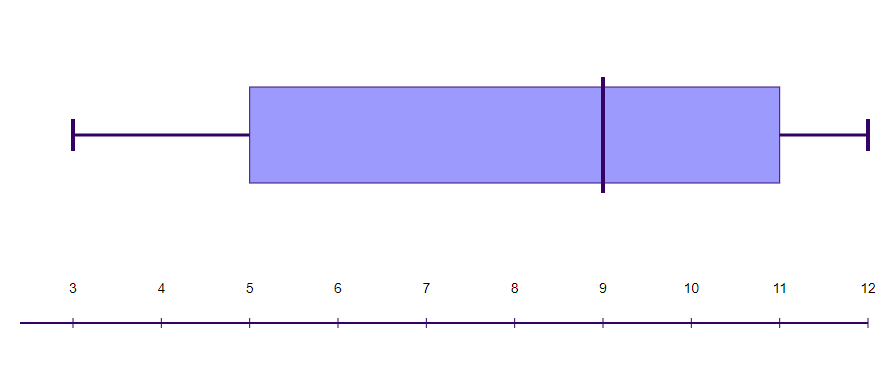
What is the median of the data represented by this box and whisker plot?

The median of the data is 9.

300
In My Neighbour Totoro, what does Mei insist on delivering to her mother?
Mei brings her mother an ear of corn that she picked.
400
Based on this Venn diagram, how many students like cats?
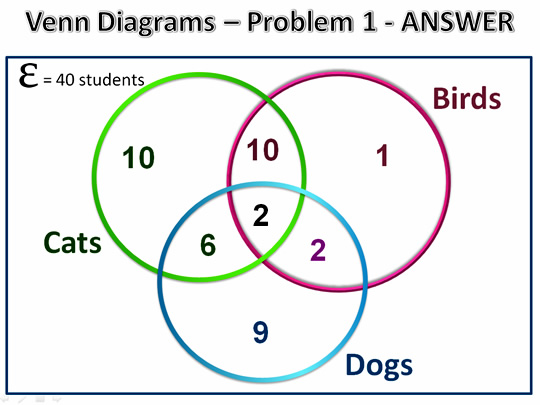
28 students like cats.
400
What is the upper quartile (Q3) of the data represented by this box-and-whisker plot?

The upper quartile (Q3) is 8.

400
What is the range of the data represented by this box-and-whisker plot?
The range of the data is 9.
400
What is the median of the data represented by this stem-and-leaf plot?
The median is 20.5
400
In Castle in the Sky/Laputa, how does Pazu first meet Lucita?
Lucita floats down from the sky to the mine where Pazu works and he catches her.
500
How many students are taking only Spanish and Chemistry?
3 students are taking only Spanish and Chemistry.
500
What is the lower quartile (Q1) of the data represented by this box and whisker plot?

The lower quartile (Q1) is 5.
500
What is the interquartile range (IQR) of the data represented by this box and whisker plot?
The IQR is 6.

500
What is the mean of the data represented in this stem-and-leaf plot?
The mean of the data is 22.5.
500
In Spirited Away, what does Haku give to Sen to eat to keep her from fading away?
Haku gives Sen onigiri.