Identifying Graphs
Vocabulary
Reading Graphs
Parts of a Graph
Reading Graphs 2
100
This kind of graph uses pictures or symbols to represent the data?
Pictograph
100
Lines used to count things instead of using numbers are called _________________.
tally marks
100
How many 4th graders played basketball this year?
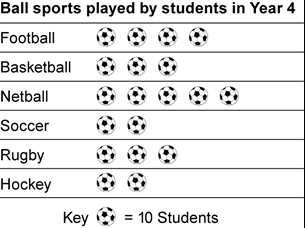
30
100
The words "M&M Bar Graph" make up what part of this graph?

the title
100
What is the most popular sport for students to play?
Netball
200

Bar Graph
200
Data you collect yourself is called?
primary or first-hand data
200
What symbol could be used on a picture graph about different kinds of food?
Possible answers: Plate, fork, different foods, etc.
200
What is this part of a graph called?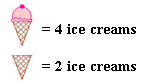
Key
200
How many more people own goldfish than rabbits?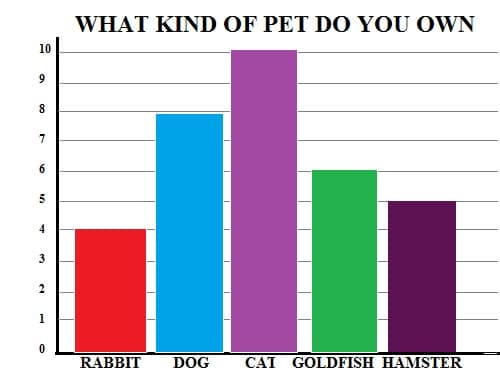
2
300
This kind of graph uses different groups of bars to display the data? (Bars represent more than one group)
Multiple-Bar Graph
300
________________ data uses numbers instead of words. The data is obtained from counting or measuring.
Quantitative
300
What is the difference between the number of students who have cats for pets and the number of students who have goldfish ?
4 more students own cats than own goldfish
300
What is the horizontal axis of a graph called? What is the vertical part of a graph called?
*must clarify which is which*
x-axis and y-axis
300
How many more cupcakes were sold on Thursday than Tuesday?
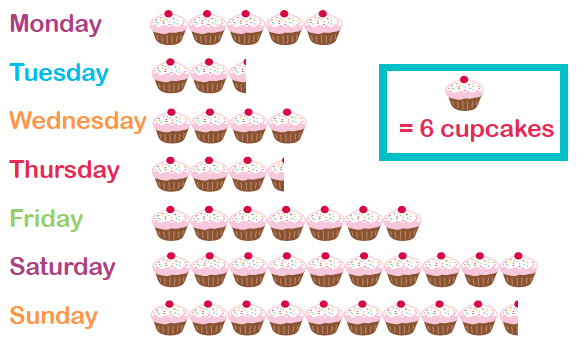
6
400
Pictograph
400
This is a type of QUANTITATIVE data. It is measured NOT counted.
Continuous Data (there is a relationship between numbers)
Example: How much rainfall did we get last week? Data is not whole numbers. Can have halves or decimals --> 1.5 mm of rain
400
How many more cupcakes were sold on Friday than on Monday?
12
400
In this graph, the bucket of sand is a __________ to represent ________ _____________.
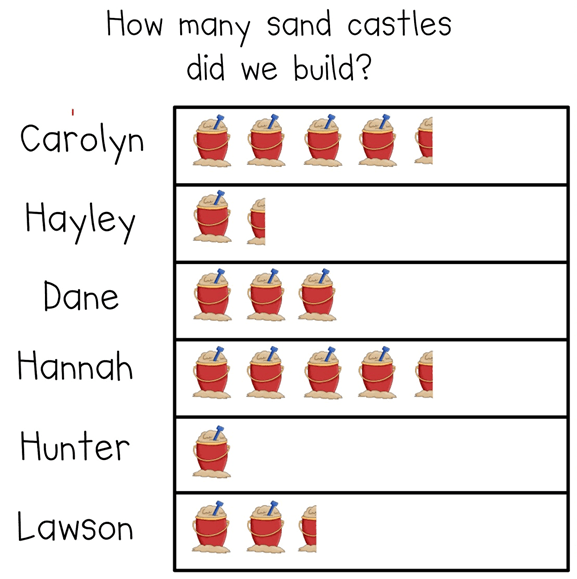
In this graph the bucket of sand is a symbol to represent sand castles.
400
How many more students played netball than rugby?
20
500
How is a bar graph different from a picture graph?
A bar graph has colored boxes instead of pictures. A bar graph has a scale and a picture graph has a key.
500
A question asked to several people to get information about one topic is a __________________.
survey
500
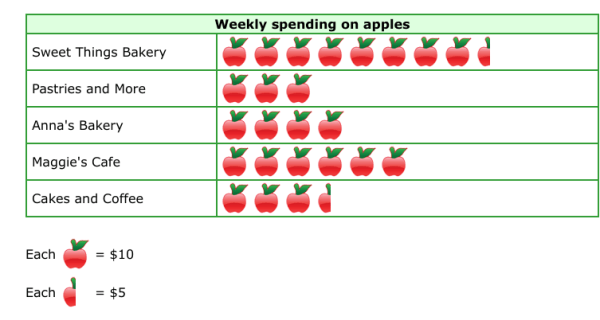
If 
Then what does 
 5 apples
500
What are the numbers along the side of this graph that show the intervals called?
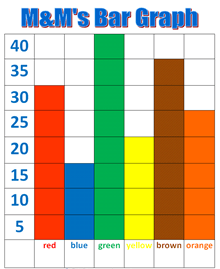
scale
500
How many more people owned dogs than hamsters?
3