Variables
Hypotheses
Corr. V Exp.
Descriptive Statistics
Inferential Testing
Other
100
Name the 3 types of variables in a scientific investigation
Independent
Dependent
Control
100
State the two hypotheses that are mainly used in psychology
Alternate
Null
100
Identify the main thing that an experiment can conclude that a correlation cannot conclude.
Which factors need to be controlled.
That there is a relationship between two independent variables.
That the change in the independent variable has caused the change in the dependent variable.
That the change in the dependent variable has caused the change in the independent variable.
3
100
Can descriptive statistics be calculated on qualitative or quantitative data?
Quantitative
100
What is the purpose of inferential statistics?
To determine if the result is significant or not
100
What is the purpose of descriptive statistics
To describe the data
200
In the experiment, 'Does temperature affect the time it takes for a reaction to produce 20mL of gas?', what is the independent variable
Temperature
200
Explain the difference between the alternate and null hypothesis
The Alternate hypothesis (HA) is what you predict to happen.
The Null hypothesis (HO) is the opposite of the alternate hypothesis
200
Which type of investigation involves two independent variables?
Correlation
200
Identify 3 descriptive statistics
Any of the following:
Mean, median, mode, range, interquartile range, standard deviation
200
What is the main value you are looking for in an inferential test for an experiment?
p - value
200
What is NOT true about control variables
A. They are not needed in an experiment
B. They are controlled by the experimenter
C. They are kept the same throughout the entire experiment
D They are needed in an experiment to make sure the results are valid
A
300
For the experiment, 'Does the volume of caffeinated drink affect your reaction times?", state 1 variable that should be controlled
Answers may vary
300
If the null hypothesis states, 'There is no relationship between the amount of sleep a person gets each night and the amount of coffee they drink,' which of the following could be an example of an alternative hypothesis for this study?
A. The amount of sleep a person gets each night does not affect the amount of coffee they drink.
B. As the amount of sleep a person gets each night decreases, the amount of coffee they drink increases.
C. As the amount of sleep a person gets each night increases, the amount of tea they drink decreases.
D. If a person drinks coffee before going to sleep at night, they will have more dreams.
B
300
Does the following graph show the results of an experiment or a correlation

Experiment
300
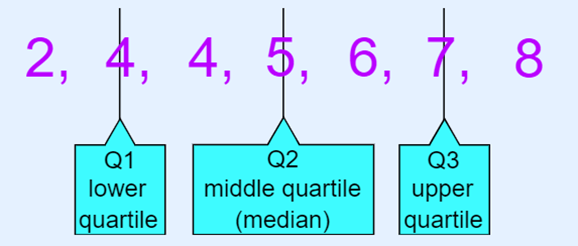
Define:
Mean
Median
Mode
Mean is the average
Median is the middle number when the numbers are listed in order from small to big.
Mode is the number that occurs the most often
300
Once data has been collected, you should ask yourself the following questions.
1.Is there a large enough sample size to find a valid and reliable conclusion?
2. Is the data normally distributed?
3. Are there any outliers that could skew the data?
Based on these questions, you decide to do a PARAMETRIC TEST.
What would have been the answers to these questions?
Yes
Yes
No
300
You want to know which soap works best to get rid of germs on your hands. You wash your hands with Soap A and use a microscope to look at your hands and count the germs you see. Then you do the same thing with Soap B. What is the dependent variable?
The amount of germs left on your hands
400
When graphing the results of an experiment, which axis (y or x) does the independent variable go on?
x
400
Which of the following is the best example of a null hypothesis?
A. There will be no relationship between the amount of cookies you eat and your blood sugar level.
B. As the amount of cookies you eat increases, your blood sugar level will increase.
C. As the amount of cookies you eat increases, your blood sugar level will decrease.
D. As the amount of cookies you eat decreases, your blood sugar level will remain constant.
A
400
The value for a correlation coefficient is always between -1 and 1. Explain what a correlation of 1, 0 and -1 means.
- -1 indicates a perfectly negative linear correlation between two variables
- 0 indicates no linear correlation between two variables
- 1 indicates a perfectly positive linear correlation between two variables
400
Find the mean, median and mode of the following data:
13, 18, 13, 14, 13, 16, 14, 21, 13
Mean - 15
Median - 14
Mode - 13
400
College students often have to decide whether to purchase hard cover or paperback textbooks. A sample of 50 hard cover books has an average cost of $32.50 and a sample of 50 paperback books has an average cost of $29.30 (p = 0.04).
Is there a significant difference between the cost of hard-cover and paperback text books?
YES
400
Identify whether the following is a repeated measure design or independent group design:
A group of people with Type II diabetes are given a different medication every 3 months to see if it helps control their disease.
Repeated measure design
500
Explain the importance of having only 1 independent variables in an experimental design
Testing only one variable at a time lets you analyze the results of your experiment to see how much a single change affected the result. If you're testing two variables at a time, you won't be able to tell which variable was responsible for the result.
500
This graph represents the results of an investigation. Suggest a unidirectional alternate hypothesis that would have been suggested prior to this data being collected.
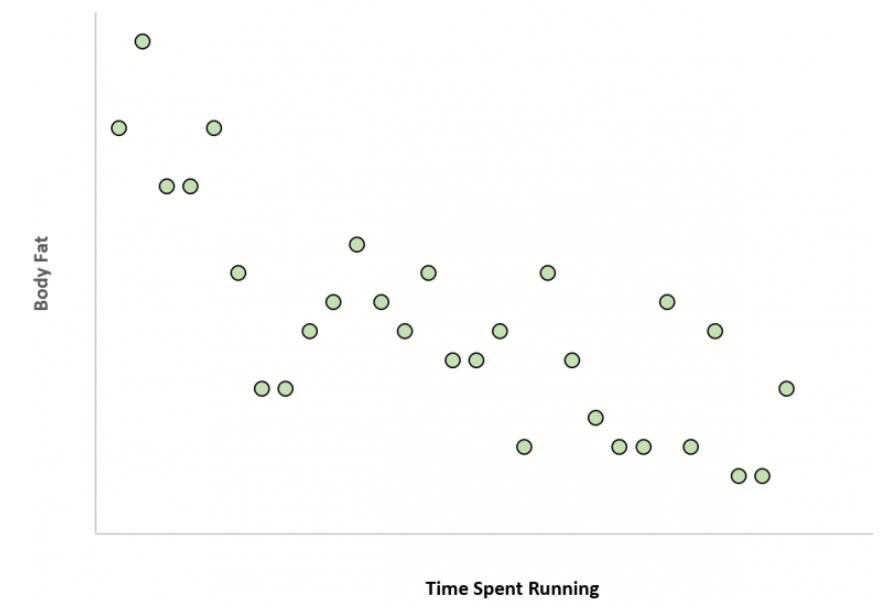
The more time spent running reduces the amount of body fat a person has
500
Sketch a scattterplot of the following:
The shoe size of individuals and the number of movies they watch per year has a correlation of zero.

500
Find the Q1 and Q2 of the following data set:
5, 7, 4, 4, 6, 2, 8
500
Suggest an r-value for the following data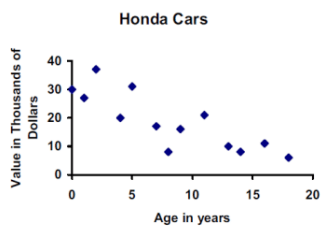
Answer will vary - should be negative and closer to -1 than 0
500
Sketch a scatterplot to represent the following correlation:
The more time a student spends watching TV, the lower their exam scores tend to be.

600
What is the relationship between dependent and independent variables?
Independent variables cause change in dependent variables
600
Below is a hypothesis. Suggest an aim for the investigation.
People will eat the same amount of popcorn irrelevant of whether the film is action, comedy or romance
To investigate whether the genre of movie watched influences the amount of popcorn eaten
600
Decide whether the following is an experiment or correlation:
An Australian study reported that MSG does not cause people to be sick/as previously reported. The researcher told subjects that he was studying ingredients in a new soft drink and fed them either MSG or a placebo in the drink. The same number and type of symptoms were reported in both the MSG and the placebo groups.
Experiment
600
Define standard deviation.
Explain what is meant by a large standard deviation value
Standard deviation is a measure of how spread out the numbers are
The more spread out the data is
600
Doeshaving a dog have an affect on a person's anxiety?
Is this is significant result?
How do you know?
Yes
Yes
No overlap in error bars
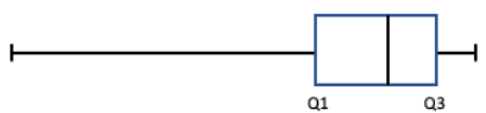
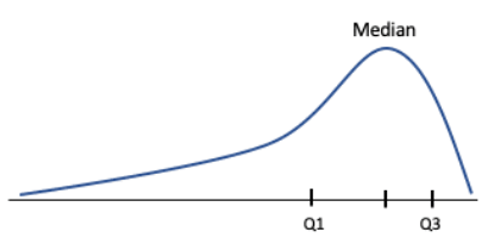
600
Sketch the distribution of data that this box plot represents