What is mode?
Mode is the data point that occurs most frequently.
What is median?
Median is the data point in the middle of the set.
What is range?
The difference between the greatest and least value.
What is a line plot?
A graph that displays data as points on a number line.
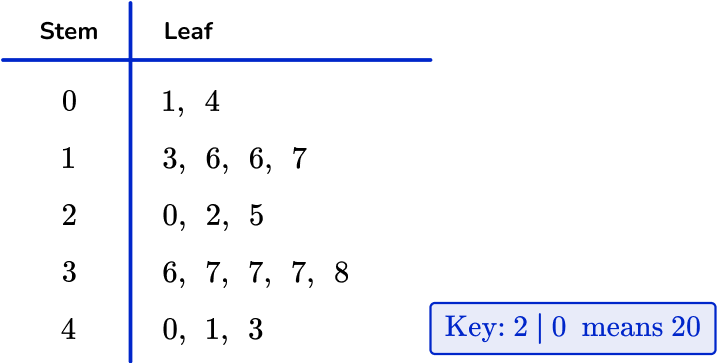
What is a stem and leaf plot?
A graph that allows you to visually see the frequency of data points.
Find the MODE: 12, 58, 50, 12, 58, 58, 63
58
What is the median of the following numbers? 13, 17, 13, 18, 45.
17
By finding the difference (subtracting) between the greatest data point and the least data point.
The line plot below shows the amount of time 13 students took to complete a quiz. How many total students took less than 3/12 of an hour to complete the quiz?

5
All stem and leaf plots must include a _____.
Key
Find the Mode 56,41,85,71,83,18,68,17,68,63
68
 What is the median?
37
The line plot below shows the amount of time 13 students took to complete a quiz. What is the range?

4/12
What's the difference between the heaviest magazine and the lightest magazine?

4/12
3. Draw a Stem Leaf for the following data. 11, 34, 13, 24, 22, 21, 39, 56, 51
Draw on your white board
The line plot below shows the measurements of some ribbons. What is the mode?
7
The line plot below shows the weight of magazines in
pounds. What is the median?
3/5
Rachel worked at a day care center where children have to take off their shoes before they come into class. Rachel measured the length of some the shoes. She put the data in the line plot below. What is the range?

3/6
4. Make a line plot.
Draw the line plot.
2. Make a stem and leaf plot.
Draw the stem and leaf plot.
 What is the mode?
54
 What is the median?
53
 What is the range?
79
5. Label the fractions on the line plot
Write your answer down.
1. The line plot below shows the amount of hours 4th graders spent studying in a week. Turn the line plot into a stem and leaf plot. 
Draw the stem and leaf plot