Analyzing box and whisker plots
Creating box and whisker plots
Analyzing a data set
Creating stem and leaf plots
Analyzing stem and leaf plots
100
If I wanted to find the median, where would I look on a box and whisker plot?
The line that goes down the middle of the box
100
What is the very first step when creating a box and whisker plot?
Put the numbers in order from least to greatest.
100
Find the mean of the following data:
5, 12, 4, 4, 17, 10
8.6
100
When making a stem and leaf plot the ________ place always goes in the stem side
A. Tens
B. Ones
A. Tens
100
In a stem and leaf plot, if I had the number 75 which number would go in the stem and which would go in the leaf?
7 In stem
5 in leaf
200
The dot to the far left on a box and whisker plot represents which of the following?
A. Maximum
B. Minimum
C. Median
B. Minimum
200
Find the minimum and maximum from the following data set:
9, 6, 15, 2, 23, 16
Minimum= 2
Maximum = 23
200
Find the median of the following data set:
5, 12, 4, 4, 17, 10
7.5
200
When making a stem and leaf plot the _________ place always goes in the leaf side.
A. Tens
B. Ones
Ones
200
How many students scored a 78 on their math test?
3
300
How many points should there be on a box and whisker plot?
5
300
Use the following data set to find the median and the lower and upper quartiles. (Hint: you should have 3 different numbers as your answer)
2, 20, 13, 19, 11, 5, 14
Median= 13
Lower Q= 5
Upper Q= 19
300
Find the mode of the following data set:
5, 12, 4, 4, 17, 10
4
300
Use the following data and input it into a stem and leaf plot:
20, 25, 30, 35, 35, 47, 50, 52, 54, 58
Look at the board for the answer
300
How many students scored lower than a 70 on the math test?
6
400
Look at the box and whisker plot below:
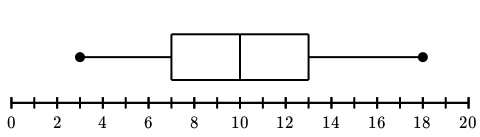
What number represents the upper quartile?
13
400
Use the following data to make a box and whisker plot:
5, 16, 6, 25, 18, 20, 11
Look at the board for the correct answer
400
Find the range of the following data set:
5, 12, 4, 4, 17, 10
13
400
Use the following data and input it into a stem and leaf plot:
5, 6, 10, 15, 15, 15, 25, 28, 34, 34, 37
See board for correct answer
400
Find the mean of the students math scores:
69.5 was the average score
500
Look at the box and whisker plot below:
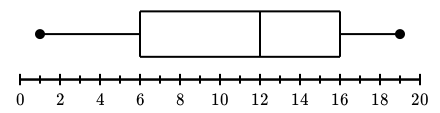
What is the minimum and maximum in this data set?
1 and 19
500
Use the following data to create a box and whisker plot:
30, 25, 16, 38, 25, 19, 18
Look at board for correct answer
500
Find the Mean, median, mode and range of the following data set:
3, 6, 16, 11, 2, 2, 20, 21
Mean= 10.1
Median= 8.5
Mode= 2
Range= 19
500
Use the following data and input it into a stem and leaf plot:
5, 5, 8, 17, 20, 25, 25, 25, 35
What is the mode of this data set?
see board for stem and leaf plot
mode= 25
500
Find the median of the following test scores:
72.5