An attempt to collect data from an entire population
Sample
What is misleading about this graph?
**choose the best answer
a) Nothing is misleading about this graph.
b) The democrats are too high.
c) The y-axis does not start at zero, so it makes the democrats look much higher than the other two parties.
c) The y-axis does not start at zero, so it makes the democrats look much higher than the other two parties.
Library Book Checkouts:
Discrete Data
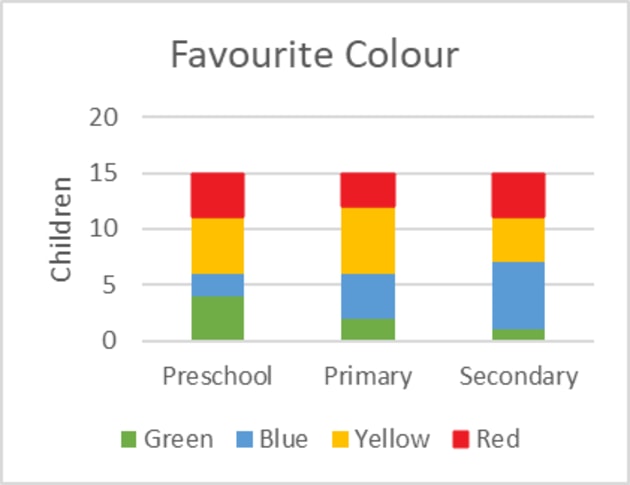
 What is the favorite color of the Primary group?
Yellow
What is the mean for this data?
25 30 15 10 20 11 15
15
Data that is numerical and involves measurements and statistics.
Quantitative Data
The average of the data set
Mean
Time in a race
Continuous Data

95
What is the median for this data?
25 30 15 10 20 11 13
15
Data with values that can be represented on a number line or a graph; usually measured rather than counted.
Continuous data
The middle of the data set.
Median
Daily temperature?
Continuous
option a and c
What is the mean for this data?
25 30 15 10 20
20
Data that can have only certain fixed values; are usually counted rather than measured.
Discrete Data
questions are broad and can be answered in detail
Open-ended questions
Roll of a Die
Discrete Data
The outcome of rolling a six-sided die is a discrete random variable. The possible values are 1, 2, 3, 4, 5, or 6.
What is the mode in this graph/data?

36
What is the mean, median and mode for this data?
52 67 51 70 83 72 90 78 77 70
Mean: 71
Median: 71
Mode: 70
Data that is is more descriptive based on observations and words.
Qualitative Data
Electric Voltage
Continuous
Voltage is a continuous variable that can take on any value within a specified range. It can be measured with high precision.
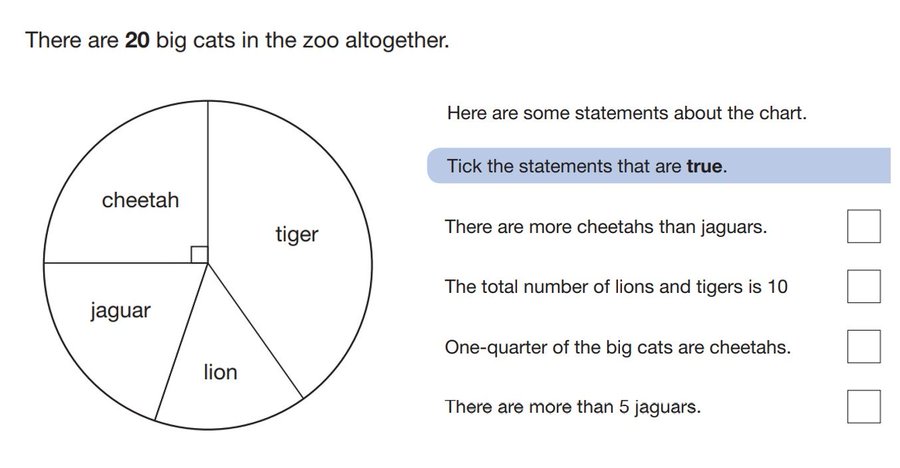
Which statement below accurately represents the graph?
answer choices:
*HARD MODE*
The mean salary of 5 employees of a company is $45. If the salaries of 4 employees are $35,$48,$42,$43. Use the information provided to determine the salary of the fifth employee.
Answer options:
$57
$42
$48
$44
$57


