Definitions
Types of Graphs
Correlations
Collecting Data
General Math
100
Data that can only be numerical. Includes discrete and continuous numerical data.
Quantitative Data
100
A type of graph that you might use to visually show different parts of a whole.
Pie Chart / Circle Graph
100
The following is an example of it:
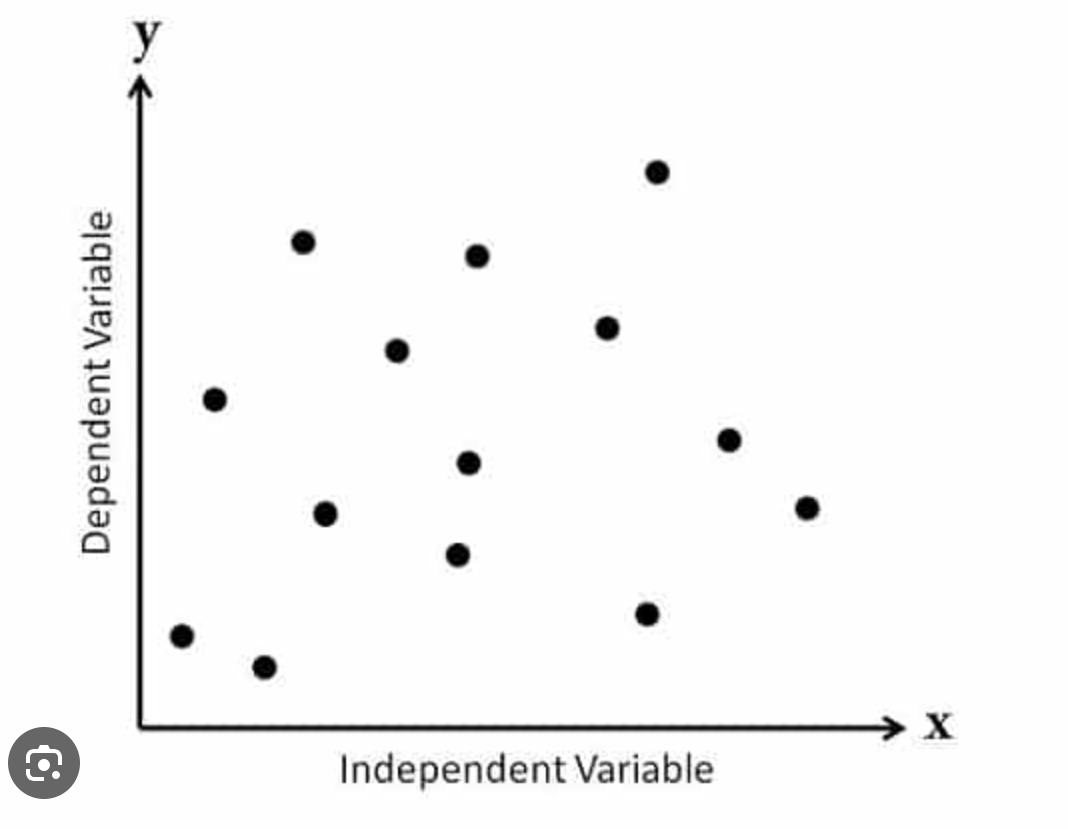
No Correlation
100
Data which is not directly collected by a researcher. For example, a grade 8 student using data from a government website for a statistics project.
Secondary Data
100
The equation for finding the area of a triangle.
A = (B*H)/2
200
Numerical data which can be measured but not counted.
Continuous Data
200
Here is an example of it:
Histogram
200
An example is shown here:
Positive Correlation/Relationship
200
An inexpensive data collection method which allows researches to get quick, simple responses from participants.
Surveys/Polls
200
The equation for calculating simple interest.
P * r * t
300
The number of times that something happens.
Frequency
300
Type of graph you might use to show the relationship between 2 variables
Scatter Plot
300
An example is shown here:

Negative Correlation/Relationship
300
Conducting 1-on-1 conversations to gain detailed qualitative data.
Interviews
300
An integer which is neither positive nor negative
zero
400
The factor in two-variable data that effects the other variable being studied.
independent variable
400
A type of graph that you might use to show the temperature every hour over a 24 hour period.
Line graph / Broken line graph
400
The correlation that you would expect to find when studying the relationship between temperature and ice cream sales.
Positive Correlation
400
A type of survey which is administered to 100% of the population.
Census
400
The equation for the volume of a cylinder.

500
a mutual relationship or connection between two or more things.
correlation
500
Here is an example of it:

Stacked Bar Graph
500
The correlation you would expect to find when examining the relationship between sun exposure and happiness
Positive Correlation
500
Data collection method that might be used by a company when testing a new product.
Focus Group.
500
A number which cannot be expressed as a fraction
Irrational number