Data Collection & Organization
Data
Graphs
Probability
Bonus
100
Used to answer any question about any topic.
What is a survey/questionnaire?
100
A collection of information; gathered by observation, questioning or measurement.
What is data?
100
A graph that uses vertical or horizontal bars to represent numerical data.
What is a bar graph?
100
The ratio of the times an event is likely to occur
What is probability?
100
I am in the middle of a data set.
What is the Median?
200
Used to record data with tally marks from any questionnaire/survey.
What is a tally chart?
200
Data collected by YOU.
What is primary data?
200
A graph that uses bars to display a set of data that has been organized into frequencies within equal intervals.
What is a Histogram?
200
4 important vocabulary terms used to describe the probability of an event occuring.
What are impossible, unlikely, even chance, likely and certain?
200
I "show up the most" in a data set.
What is the Mode?
300
Used to record data with numbers from any questionnaire/survey.
What is a table?
300
Data collected by SOMEONE ELSE.
What is secondary data?
300
All graphs need "us".
What are a title, a X & Y axis, axis labels and a scale?
300
What SHOULD happen.
What is theoretical probability?
300
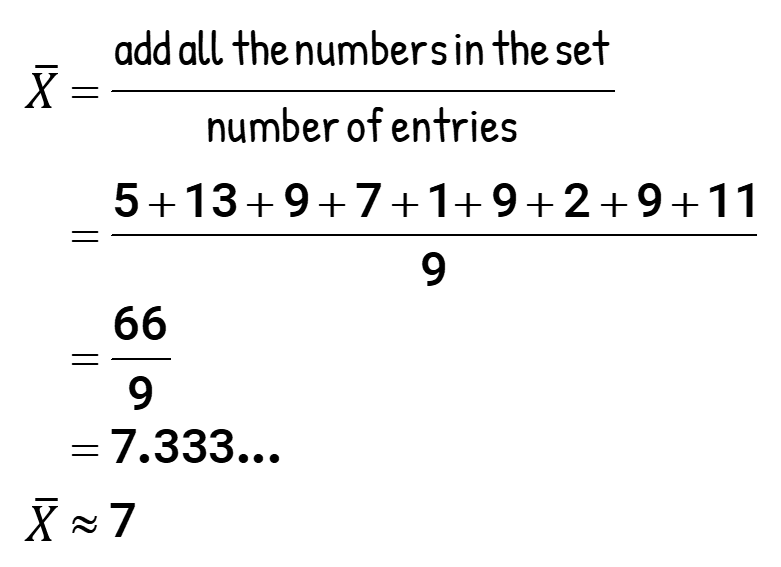
What is the Mean?
400
The type of pet with the highest frequency.

What is a dog?
400
Organized in this for analysis.
What is a graph or a chart?
400
Type of graph used to show changes over a period of time.
What is a Line Graph?
400
What DOES happen.
What is experimental probability?
400
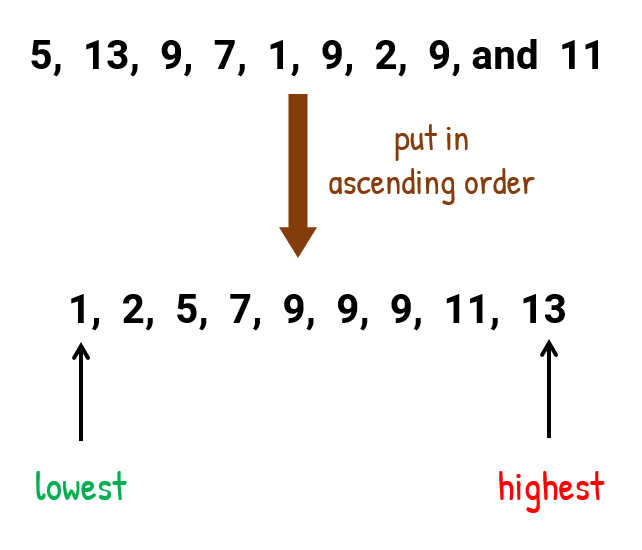
What is the range?
500
The colours which have equal frequencies.
What are orange & green, yellow & indigo and blue & red?
500
When an entire population is surveyed to gain results.
What is Census Data?
500
What is a circle/pie graph?
500
When we toss a coin 100 times, we expect to get heads 50 times.
What is theoretical probability?
500
17, 17, 18, 21, 27
? = 20
? = 18
What is the Mean and the Median?