Tally Charts
Pictographs
Bar Graphs
Mixed
Vocabulary
100
How many marbles do the children have?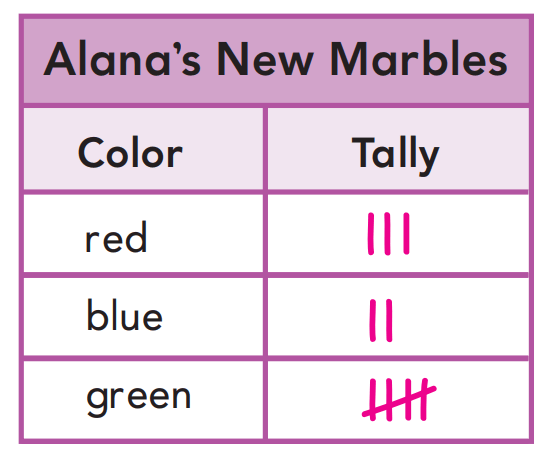
10
100
Who scored the most points?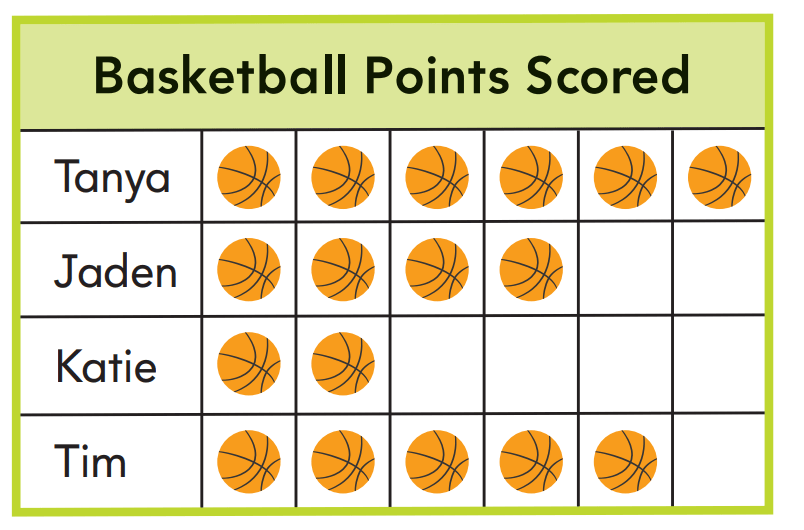
Tanya
100
What was the least favorite vegetable?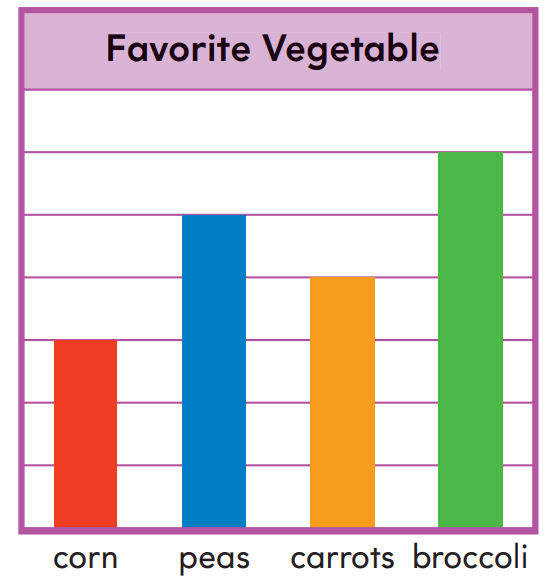
corn
100
How many books were sold on Wednesday and Thursday?
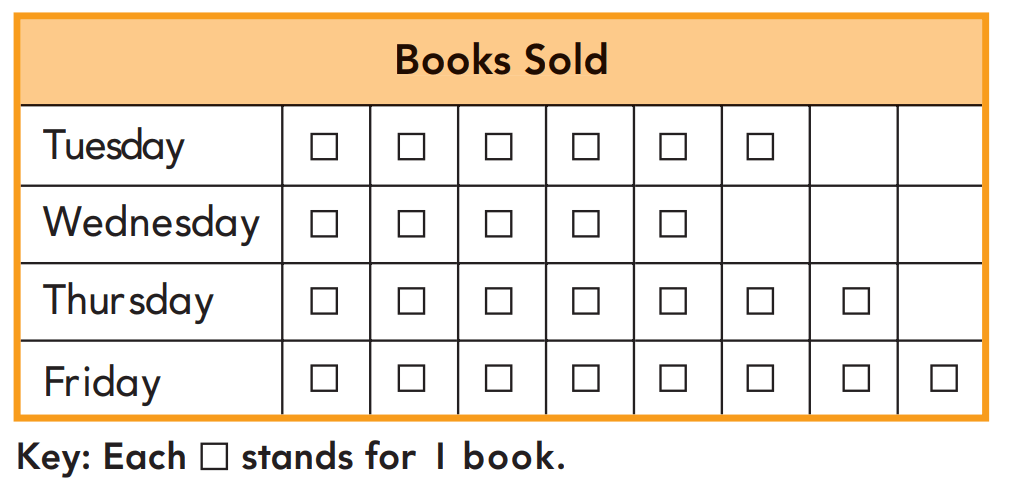
12
100
I will collect ___________ when I am doing a survey.
data
200
How many more students voted for blue than red?
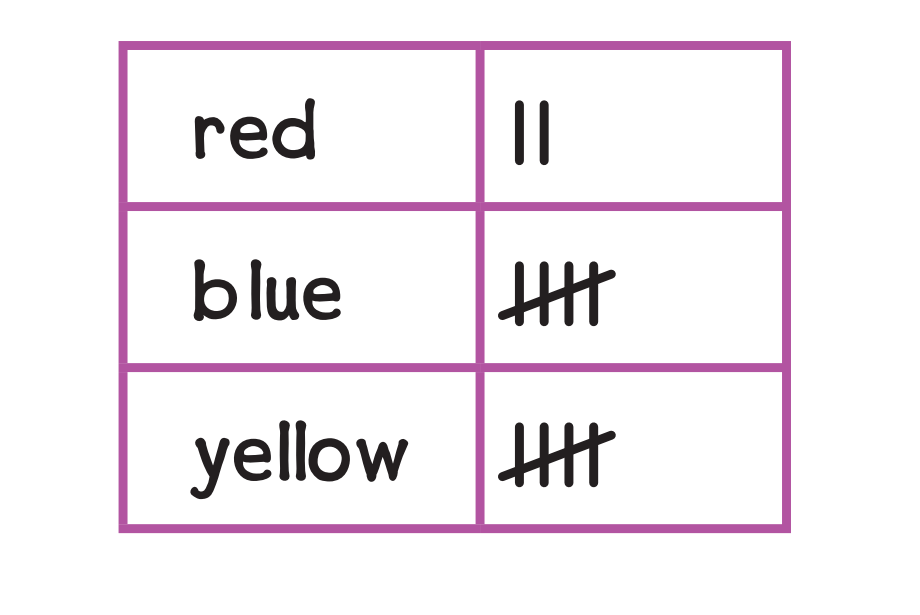
3
200
How many students choose both reading and math?
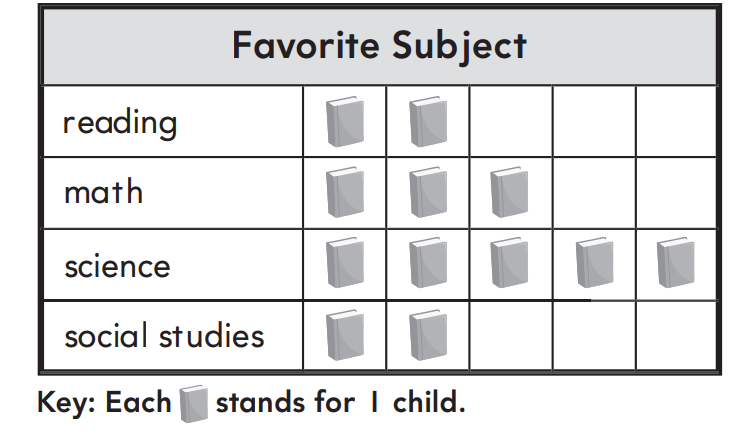
5
200
Who scored the most goals?
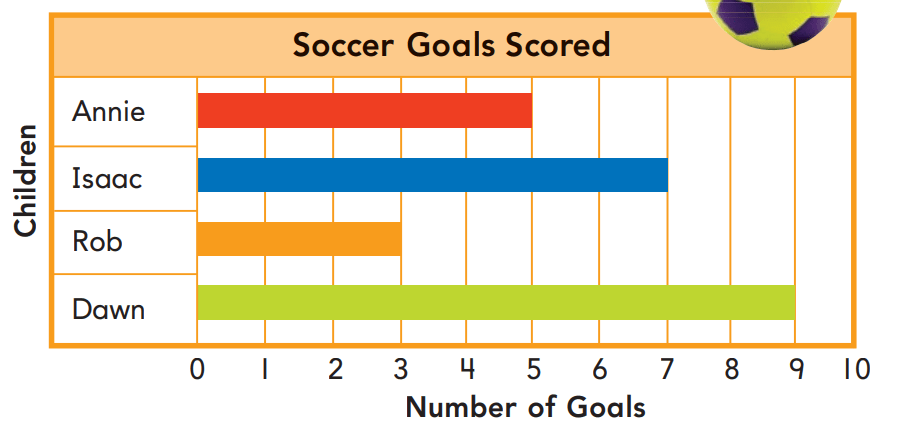
Dawn
200
How should you finish the chart to show 8 book?
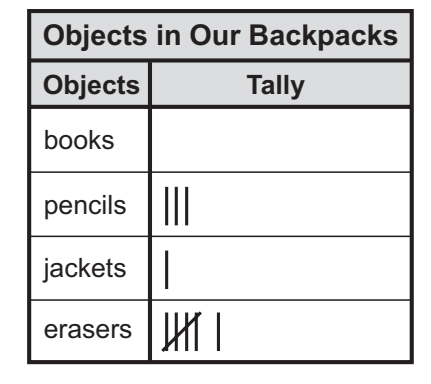

200
I can use _____________ marks to collect data.
tally
300
Which sandwich did the most students choose?
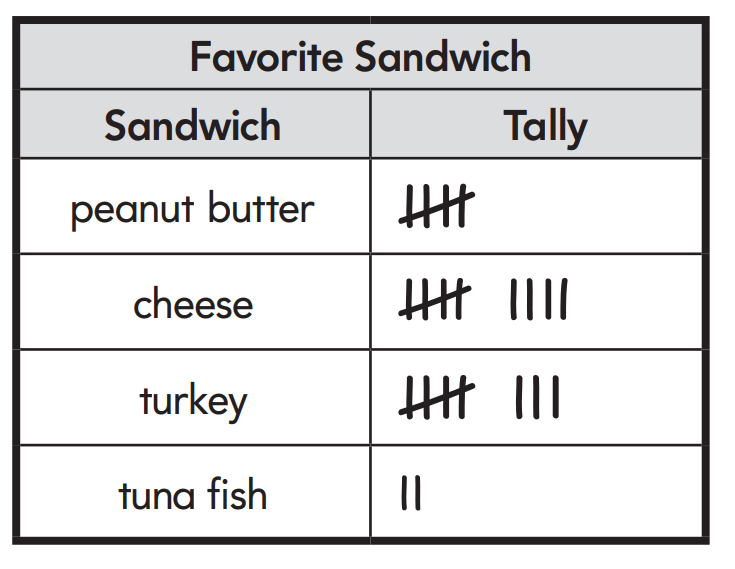
cheese
300
How many more students choose video games than board games?
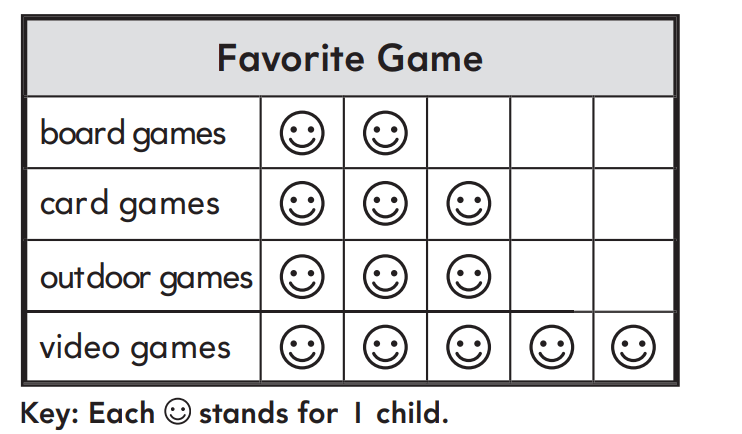
3
300
How many students choose cheese and veggie pizza?
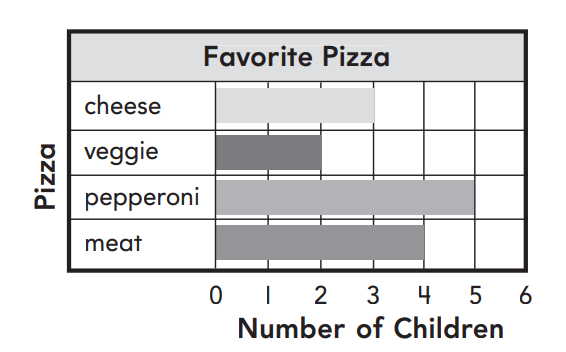
5
300
How many more children chose potatoes than broccoli?
2
300
I can take a ______________ to find out the classes favorite holidays.
survey
400
How many more students chose turkey than tuna fish?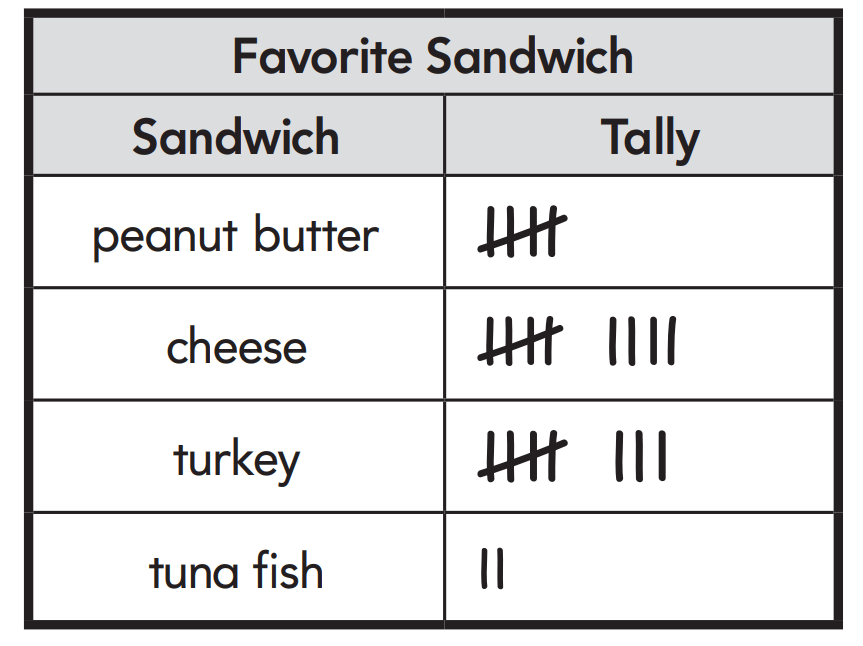
6
400
How many children took the survey?
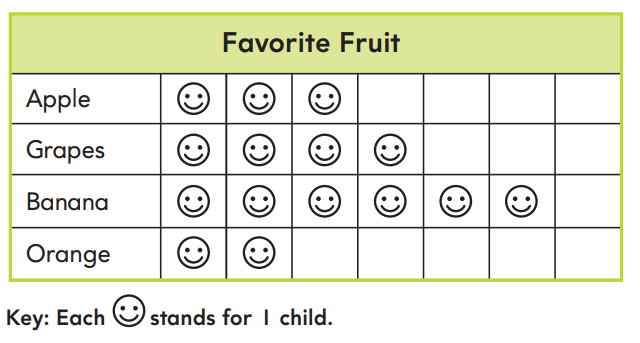
15
400
How many more red leaves were found than yellow leaves?
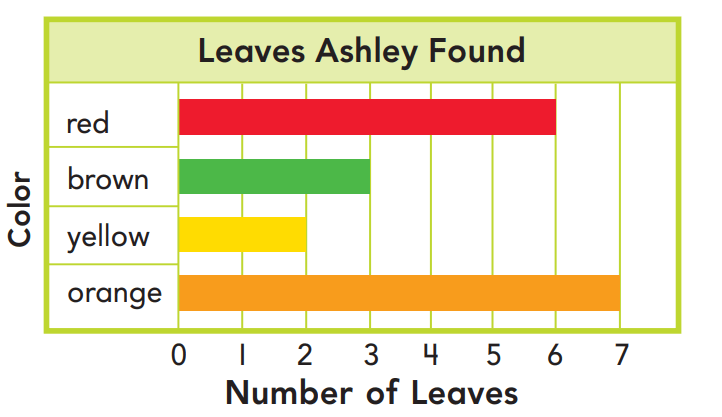
4
400
How many pets do the children have?
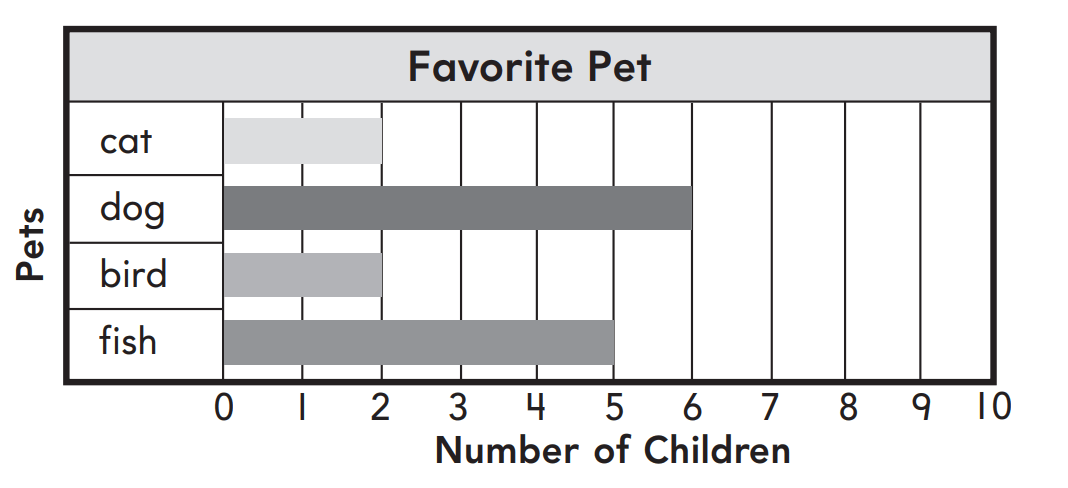
15
400
A ___________ has a picture that shows data.
pictograph