Mean, Median, Mode, and Range
Box and Whisker Plot
Histogram questions
Vocabulary
100
Find the mode of this data...
0 , 1 , 2 , 3, 4, 5, 6, 7, 8, 9, 10
no mode
100
What five things do we display in a box and whisker plot?
Minimum, Lower Quartile, Median, Upper Quartile, and Maximum
100
How many members are 12 years old?

4
100
In a data set, what number appears most often?
Mode
200
Find the median of the data...
14, 12, 10, 15, 18, 23, 19, 16
15.5
200
What forms the whiskers of a box and whisker plot?
The minimum and maximum
200
How many members are 15 years old?

11
200
In a data set, what number is in the middle?
Median
300
Find the mean of the data...to the nearest tenth. 2, 10, 24, 6, 10, 12, 14, 18, 28
13.8
300
What is the highest number in a box and whisker data set?
Maximum
300
How many members are at least 18?

5
300
In a data set, what number represents the "average?"
Mean
400
What is the mode for the following data set: 30, 37, 33, 32, 38, 36, 27, 2, 34
no mode
400
What is the lower median of a box and whisker data set called?
Lower quartile (Q1)
400
How many are members of the swimming club?

52
400
In a data set, what number tells you the difference between the highest number and lowest number?
Range
500
What is the range of this data set: 849, 544, 899, 758, 691, 836, 586, and 821.
355.
500
Create a box and whisker plot out of the data. 2, 8, 5, 6, 12, 15, 3, 10, 4, 14, 20, 0
Minimum = 0 Maximum= 20 Median = 9 Lower Quartile = 4 Upper Quartile = 14
500
What percentage of students are 14?
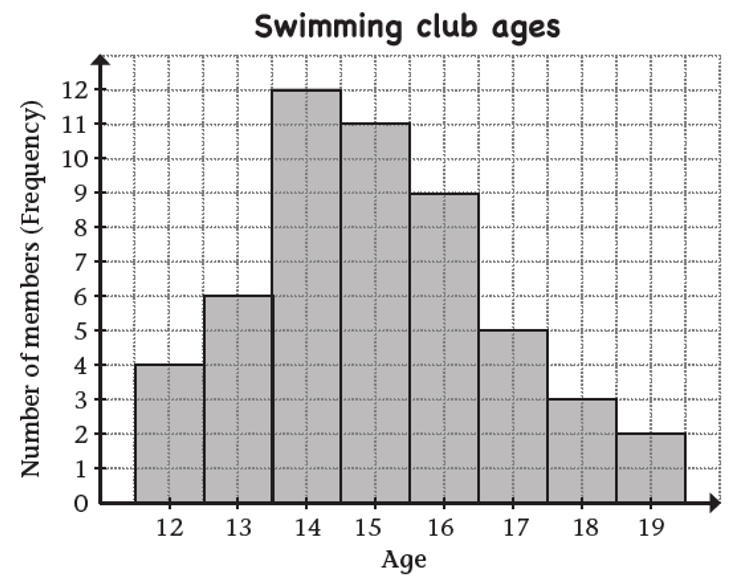
23%
500
What are some different ways to show mean, median, mode, and range? Think about how we would REPRESENT the data.
Box and whisker plots, dot plots, and histograms