Vocabulary
Stem and Leaf
Scatter Plot
Box and Whisker
100
A graph with points plotted to show a possible relationship between two sets of data
What is a scatter plot?
100
This is the left part of this type of plot.
What is the stem.
100
Describe this association.
What is strong and positive?
100
For a box-and-whisker plot, this many points should be plotted above the number line.
What is 5?
200
I am the lonely dot that doesn't stick with my scatter plot group.
What is an Outlier?
200
When making a key for your stem-and-leaf plot, 7/4 would represent this whole number (which should appear in the data set.)
What is 74?
200
A scatter plot that seems to be always decreasing is said to have this.
What is a negative correlation?
200
The center point that is plotted above the number line will represent this measure of center for a data set.
What is the Median?
300
Each section of a box and whisker plot represents this percentage of the data.
What is 25%
300
For this set of data, the stem-and-leaf plot will have this many leaves (total). 87, 73, 80, 81, 104, 113, 108, 75, 78, 101, 87
What is 11?
300
This scatterplot has this correlation.
What is No Correlation?
300
What percent of student scored below 70?
What is the 75%?
400
A line that describes the trend of the data in a scatter plot.
What is the line of best fit? (or trend line)
400
This is how we find the Interquartile Range.
What is Q3 - Q1?
400
If a person is 45 years old, based on the scatter plot, what should they expect their income to be?
A. 20,000
B. 45,000
C. 50,000
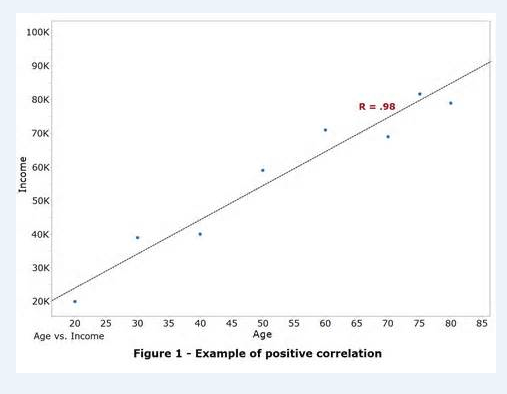
What is C. 50,000
400
The whiskers on a box-and-whisker plot extend from the first quartile to the minimum and from the third quartile to this value.
What is the Maximum?
500
True or false.
If a stem has no values you place a zero in the leaf place.
False. Just leave the leaf blank for that stem
500
For this set of data, the stem-and-leaf plot will have this many stems. 87, 73, 80, 81, 104, 113, 108, 75, 78, 101, 87
What is 5?
500
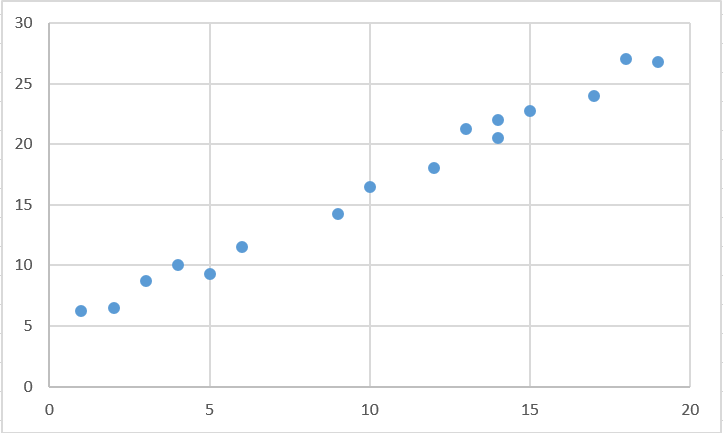
What is the equation for this line of best fit?
A. y = 10x + 10
B. y = x
C. y = 10x
D. y = x + 10
What is C. y = 10x
500
Find the 5 Number Summary for the data set below: 2, 3, 4, 5, 5, 6, 7
Min = 2 Max = 7 Median = 5 Q1 = 3 Q3 = 6