Statistical Questions
Dot Plots
Histograms
MMM
Interpreting Graphs
100
Statistical or Non-Statistical:
How many quarters does it take to make a dollar?
Non-Statistical
100
Dot plots are used to represent what type of data?
Numerical Data
100
True or False: You can tell specifics about a data set in a histogram.
Ex. How many dogs weigh exactly 24 pounds.
False!
Data is sorted into bins and not easily identifiable for specifics.
100
What is another word for mean?
Average
100
What is the mode of this data set?
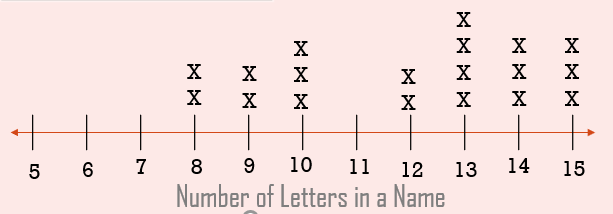
13 letters
200
Statistical or Non-Statistical:
In what year was the first nickel made in the United States?
Non-Statistical
200
How can you determine how many items are being represented on the dot plot?
Count the number of dots you see.
200
When is it beneficial to use a histogram?
A lot of data! Too many dots to represent on a dot plot.
200
What is the mode?
The most frequent number in a data set.
200
According to the histogram, how many trees are between 250 cm and 300 cm?
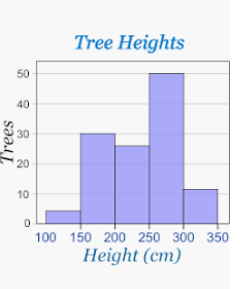
50 trees
300
Statistical or Non-Statistical:
Among all of the dimes at a bank, what is the most frequent year the dimes were made?
Statistical!
You would have to check every dime and record the year it was made. Dimes would have a variety of dates.
300
What symbol do we use to mark the mean on a dot plot?
Triangle
300
Here is a data set:
2, 4, 4, 5, 6, 7
What is the frequency of a bin labeled "0-5" on a histogram?
3
(2, 4, 4)
300
What is another word for median?
The "middle"
300
What is the median of this data set?
3 hours
400
Statistical or Non-Statistical:
What coin (penny, nickel, dime, or quarter) is used most frequently in transactions at a bank?
Statistical!
You would have to record coins used in every transactions - all with different frequencies of coins used.
400
True or False: If there are many of one number in a dot plot, it is shown by dots in a vertical line above the number.
True
400
True or False: The measure of center can be seen on a histogram by the tallest bar created by the data.
False! Just because it is the tallest doesn't make it the measure of center. Find a point where the data set is split half and half to find the measure of center.
400
Find the mean of the following data set:
4, 8, 10, 2
mean = 6
400
How many trees are at least 250 cm tall?
61 trees
500
Statistical or Non-Statistical:
On average, how many pennies do people receive in change when they make a purchase at a store?
Statistical!
You would have to record every customer's change and number of pennies they receive - all customers would have a different number of pennies.
500
Describe how to determine the variability of a dot plot.
The spread! The bigger the spread, the wider the variability. The smaller the spread, the smaller the variability.
500
Here is the data set of ages of siblings:
5, 14, 15, 15, 16
Would you say anyone has an unusual age?
Yes, age 5 is unusual in the data set of ages of siblings.
500
The mean of four numbers is 8. Three of the four numbers are 5, 9, and 14. What is the fourth number?
4
500
What is the mean of this data set?
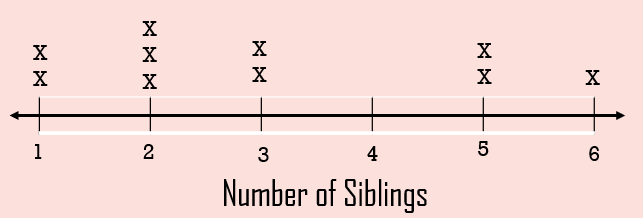
3 siblings