the difference between the greatest value and least value in a data set.
Range
WHAT IS THE MODE
10
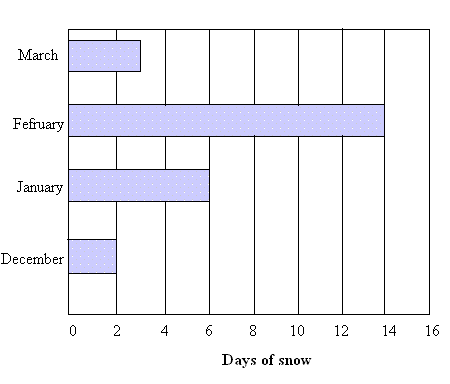
 HOW MANY DAYS OF SNOW IN JANUARY AND FEBRUARY?
20

HOW MANY PEOPLE OUT OF 100 OWN CATS?
30
(line plot) a number line with marks or dots that show frequency
Dot Plot
WHAT IS THE RANGE?
12

HOW MANY DAYS OF SNOW WERE THERE TOTAL?
25

OUT OF 200 STUDENTS HOW MANY OWN DOGS?
110
sum of the items in a set of data divided by the number of items in the set
Mean

HOW MANY PEOPLE SPENT 5 OR MORE HOURS ON HOMEWORK PER WEEK?
8

TRUE OR FALSE: 3RD GRADERS LIKE SOCCER AND BASEBALL MORE THAN 4TH GRADERS LIKE SWIMMING AND BASEBALL
TRUE
 OUT OF 300 STUDENTS, HOW MANY DANCE?
75
What two ways can you find % of a number?
1) Change you % to a decimal and multiply by your total. 2) Create a proportion with the given info.
the difference between the upper and lower quartiles in a box plot.
Interquartile Range

HOW MANY PEOPLE SPENT 0 to 2 HOURS ON HOMEWORK?
10

HOW MANY 4TH GRADERS WERE ASKED ABOUT THEIR FAVORITE SPORT?
80

OUT OF 250 PEOPLE, HOW MANY LIKE DODGEBALL?
100
What are the three shapes of a dot plot?
Symmetric, skewed right, skewed left
information collected for reference or analysis
Data
 WHAT IS THE MEDIAN NUMBER OF HOURS SPENT ON HOMEWORK?
3

HOW MUCH MORE RAINFALL WAS THERE IN 2012 THAN IN 2011?
2011 : 400+500+400=1300
2012 : 500+300+600=1400
1400-1300 = 100

TRUE OR FALSE : MORE PEOPLE LIKE RUGBY AND BASKETBALL THAN PEOPLE LIKE DODGEBALL
FALSE
What graph compares "categorical" data and can be represented by numbers or words?
Bar graph
