Data Interpretation
Analyzing Graphs
Statistical Terms
Data Trends
Data Collection Methods
100
This type of chart uses slices to show relative frequencies.
What is a pie chart? or What is a circle graph?
100
When interpreting a bar graph, the height of each bar represents this.
What is the value or frequency?
100
This term describes the middle value of a dataset when it is ordered from least to greatest.
What is the median?
100
If a line graph shows a steady upward slope, the data indicates this type of trend.
What is an increasing trend?
100
This data collection method involves asking people questions to gather information directly.
What is a survey?
200
This measure of central tendency is calculated by adding all values and dividing by the number of values.
What is the mean?
200
This type of chart is best for comparing parts of a whole at a single point in time.
What is a pie chart or circle graph?
200
This term refers to the difference between the highest and lowest values in a dataset.
What is the range?
200
When data points create a downward slope in a scatter plot, it indicates this type of correlation.
What is a negative correlation?
200
This type of study observes subjects without influencing them, often used in social sciences.
What is an observational study?
300
In a dataset, this is the value that appears most frequently.
What is the mode?
300
On a scatter plot, this type of correlation is indicated when the points trend upwards from left to right.
What is a positive correlation?
300
This term is used for data points that are significantly higher or lower than the majority of values.
What are outliers?
300
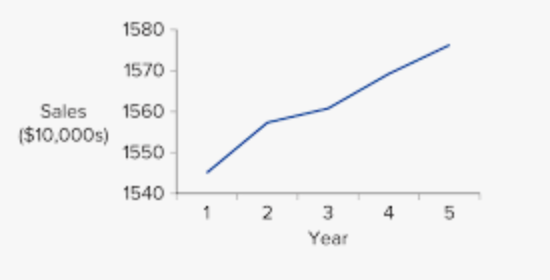
What is an increase? or What is growth?
300
This term describes a sample that accurately reflects the characteristics of the population.
What is a representative sample?
400
This type of graph is ideal for showing trends over time.
What is a line graph?
400
This graph uses dots to represent the frequency of data along an x-axis.
What is a dot plot?
400
This value is the difference between the first quartile and the third quartile in a dataset.
What is the interquartile range? or What is range?
400
This term describes a data pattern that repeats at regular intervals.
What is a cyclical pattern?
400
This method involves randomly selecting participants from a population to ensure unbiased results.
What is random sampling?
500
This statistical measure indicates the spread or dispersion of a dataset.
What is the standard deviation?
500
When a histogram has one peak, it is described as this.
What is unimodal?
500
This measure describes how much individual data points differ from the mean.
What is variance?
500
What is no growth? or What is stagnation?
500
This type of bias occurs when participants self-select into a study, potentially skewing results.
What is selection-bias? or What is bias?