ST. dev and variance
measures of position
S.O.C.S.
more S.O.C.S
more
100
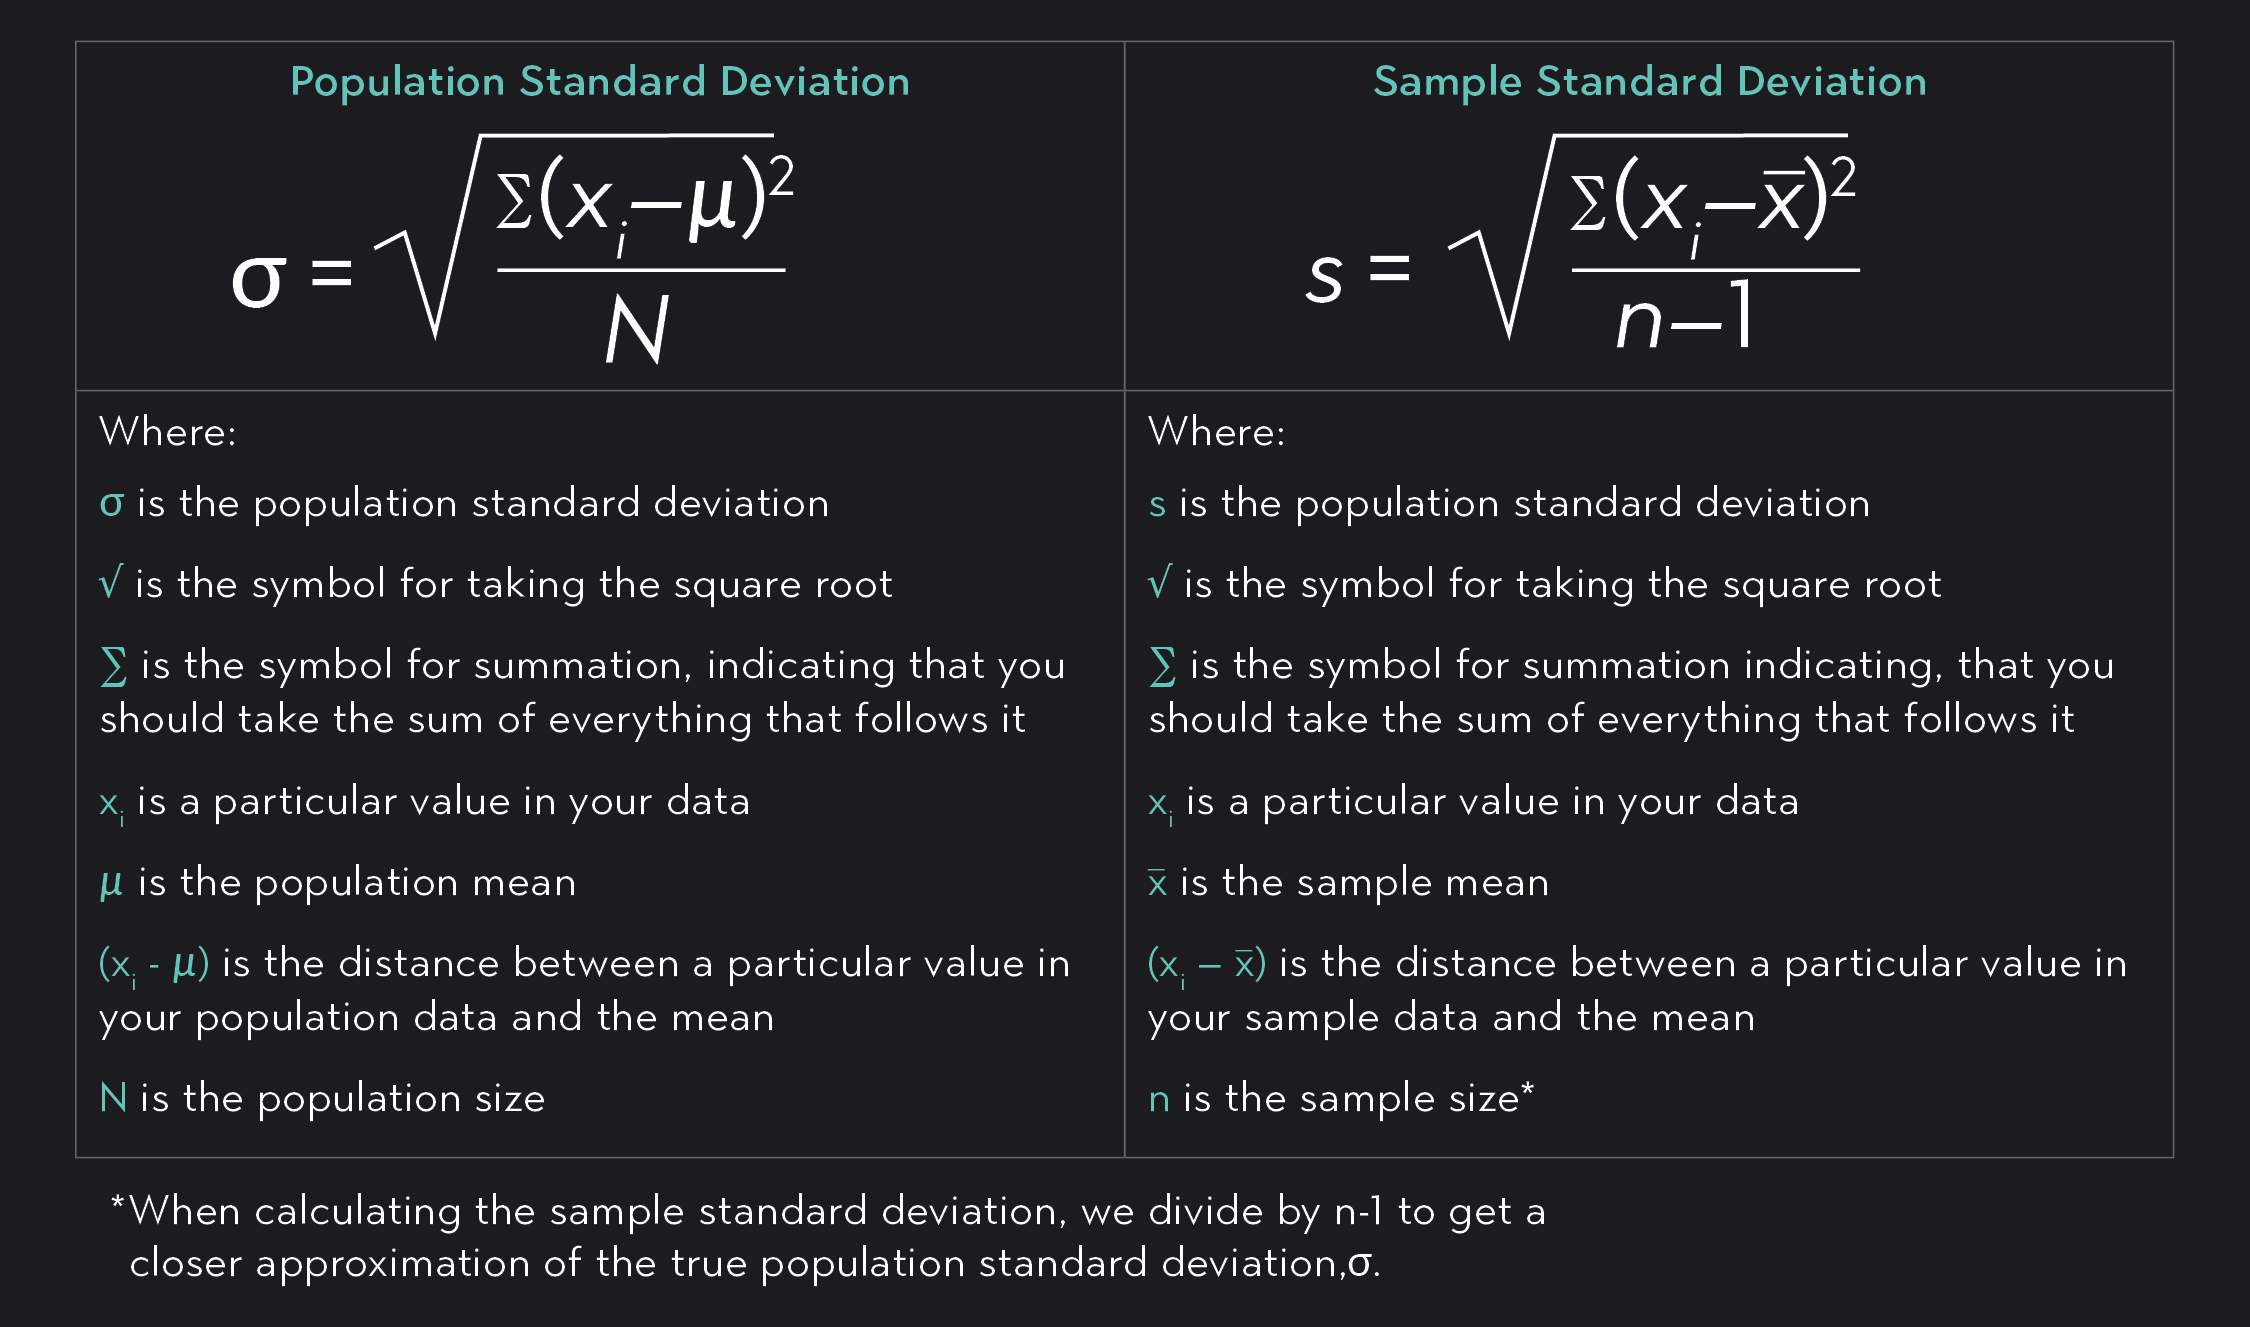
each symbol for population and sample standard deviation formula and what it stands for
100
The three measures of position
Percentiles, quartiles, Z score
100
what does S.O.C.S. stand for and what is it used for
Shape, outlier, center, spread. used for describing data
100
Calculate the centers of this data set: 4,6,6,7,8,9,10
mode:6 mean:7.14, median:7, midrange:7
100
A numerical value that describes an entire population is called
what is a parameter
200
The variance of a population is 36, this is the standard deviation
what is 6
200
A value has a Z score of 0, this describes its position in the data set?
equal to the mean
200
DEFINE BIMODAL, UNIMODAL, AND MULTIMODAL
UNIMODAL: ONE MODE(PEAK)
BIMODAL: 2 MODES (PEAK)
MU
200
This measure of spread represents the middle 50 percent of the data
what is IQR
200
5 number summary consists of
min, q1, median,q3, and max
300
The population standard deviation of this data set:5,5,5,5
0
300
A data set has mean 100 and standard deviation 15, this is the Z score of a value of 85
What is -1
300
lower and higher bound outlier from this dataset:2,4,5,6,7,8,20 show work
lower bound=-2 higher bound=14
outlier:20
300
S.O.C.S DATA SET: 4,5,6,7,8,10,18
SHAPE: right skewed
OUTLIER:18
CENTER: mean: 8.29, median:7, midrange:11, mode:none
SPREAD: IQR:5, RANGE:14, SD:4.46
300
5 number summary for scores on stats test was 11,35,61,70,70. in all, 390 students took the test. how many students had scores between 35 and 61
95
400
The population standard deviation of this data set: 1,2,3,4,5
1.41
400
this is how long in minutes it takes a student to complete a problem in math and physics:
math: 3,4,5,6,7
physics: 1,3,5,7,9
create a box plot and compare medians and IQR
MATH
MIN:3,Q1:4,MEDIAN:5, Q3:6,MAX:7, IQR:2
PHYSICS
MIN:1,Q1:3,MEDIAN:5,Q3:7,MAX:9, IQR:4
400
A data set is right-skewed with a high outlier. This measure of center will be greater than the median.
what is the mean?
400
S.O.C.S. :5,7,8,9,10,11,12,14,16,30
SHAPE: right skewed, OUTLIER:30, CENTER: MEAN:12.2,MEDIAN:10.5,MODE:NONE, MIDRANGE:17.5
SPREAD: RANGE:25,IQR:7.5, ST. DEV:6.69, VARIANCE=44.76
400
(0-4)--> f=2
(5-9)--> f=3
(10-14)->f=4
(15-19)->f=1
(20-24)->f=2
calculate median of this grouped frequency
(10-14)
500
A normal distribution has a mean of 70 and a standard deviation of 4. This percent of data lies between 66 and 74.
what is 68 percent
500
this measure of position tells the percentage of data values below a given point
What is percentiles
500
A distribution that is mound-shaped and balanced about the center is described as this.
what is symmetric or normal distribution
500
sample st deviation and sample variance: 3,5,6,7,8,9,10,12,15,25
sd: 6.31 and variance: 39.78
500
(0-4)--> f=2
(5-9)--> f=3
(10-14)->f=4
(15-19)->f=1
calculate mean of this grouped frequency table
9--> (5-9)