Put 'Em Up
I'm the Standard
[Insert Histogram Joke Here]
Lots of Trees
Random Stuff
Grant Trivia
100
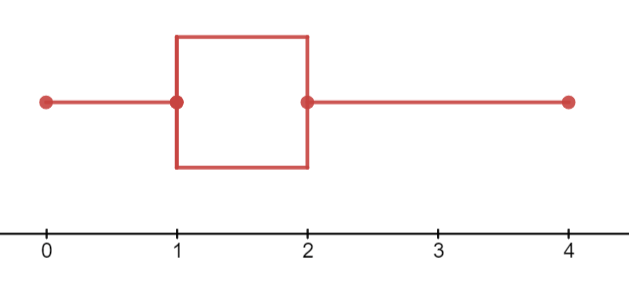
What are the five points you need to make a box plot?
Minimum, Q1, Median, Q3, and Maximum
100
Is the equation for standard deviation of a sample or population?
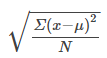
Population!
100
When do we use a Histogram instead of a bar graph?
When the dataset is LARGE
100
What's the mode of the following data?

43
100
Should I use a bar graph or line graph for the following situation?
The scores of this class on the test next week
Bar Graph
100
How many dogs does Mrs. Grant have?
one
200
What is the Interquartile Range?
Q3-Q1
200
Which data set is more spread out, given the standard deviation?
A: 4.2
B: 2.4
C: 1.4
D: 5.1
D: 5.1
200
What are the outliers of the dataset? (Without calculating)
56, 61, 75
200
What's is the symbol for a population mean?
mu
200
What is Mrs. Grant's dog's name?
River
300
Find the Q1 and Q3 of the data set:
5,6,6,7,7,8,9,10,11,11,11,12,13,14,15,16,16,18
Q1 = 7
Q3 = 14
300
Find the value that is 2 standard deviations from the mean, given the following:
\overline x = 4.3
STDEV = 2.1
8.5 and 0.1
300
How many people have between 25 and 29 apples?
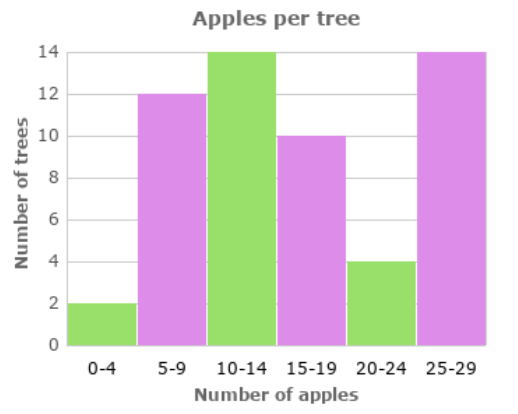
14
300
What's the median of the following data?
32
300
Who's rule is this?
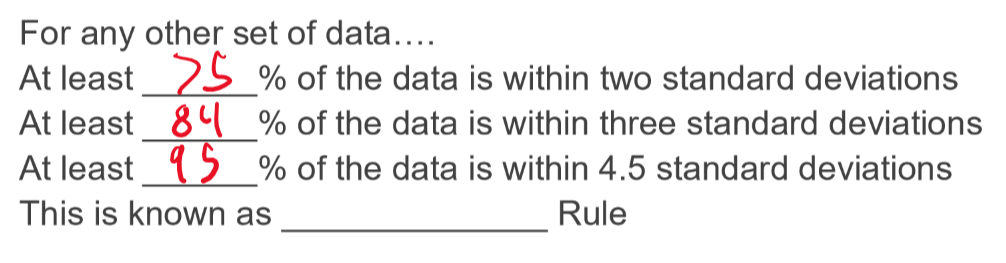
Chebyshev's Rule
300
Mrs. Grant attended this University for her undergraduate degree.
Boston College
400
DOUBLE JEOPARDY
Find the IQR
How is it skewed, if the mean is 32?

IQR = 44-23 = 21
Skewed Left
400
Two swimmers, Angie and Beth, from different teams, wanted to find out who had the fastest time for the 50 meter freestyle when compared to her team. Which swimmer had the fastest time when compared to her team?
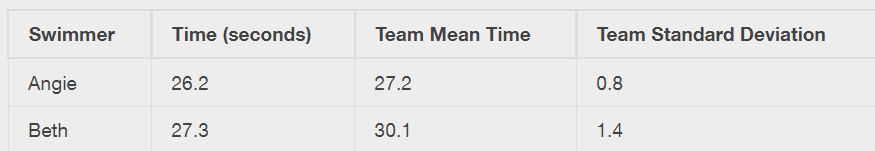
Angie was faster compared to her team
400
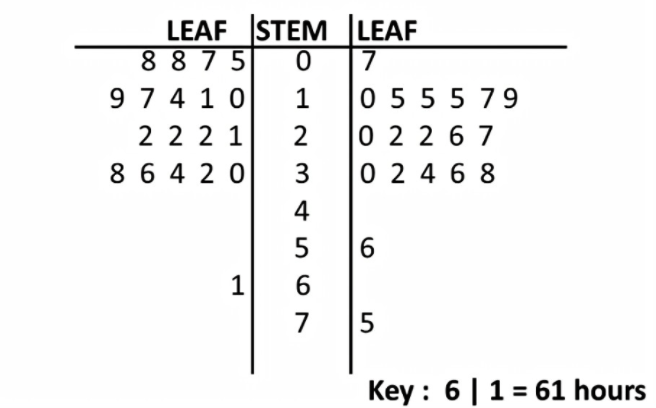
How wide should our bars be if we used this data to make a histogram, and make 8 bars?
60; 60.5; 61; 61; 61.5, 63.5; 63.5; 63.5, 64; 64; 64; 64; 64; 64; 64; 64.5; 64.5; 64.5; 64.5; 64.5; 64.5; 64.5; 64.5, 66; 66; 66; 66; 66; 66; 66; 66; 66; 66; 66.5; 66.5; 66.5; 66.5; 66.5; 66.5; 66.5; 66.5; 66.5; 66.5; 66.5; 67; 67; 67; 67; 67; 67; 67; 67; 67; 67; 67; 67; 67.5; 67.5; 67.5; 67.5; 67.5; 67.5; 67.5, 68; 68; 69; 69; 69; 69; 69; 69; 69; 69; 69; 69; 69.5; 69.5; 69.5; 69.5; 69.5, 70; 70; 70; 70; 70; 70; 70.5; 70.5; 70.5; 71; 71;71, 72; 72; 72; 72.5; 72.5; 73; 73.5, 74
2! (Round up to 2)
\frac{74.05-59.95}{8}= 1.76
400
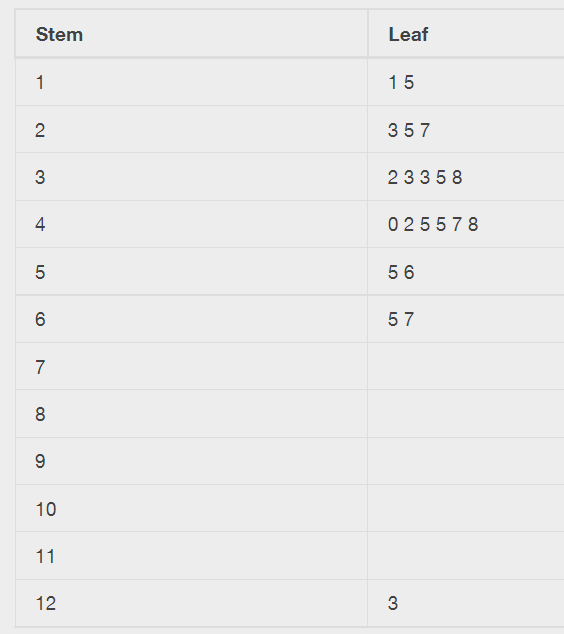
Make a Stem and Leaf Plot of the following dataset:
1.1; 1.5; 2.3; 2.5; 2.7; 3.2; 3.3; 3.3; 3.5; 3.8; 4.0; 4.2; 4.5; 4.5; 4.7; 4.8; 5.5; 5.6; 6.5; 6.7; 12.3
400
Find the measures of center of the dataset:
20,20,21,21,22,23,23,25,26,26,26,28
Mode: 26
Median: 23
Mean: 23.4
400
Name one country (other than United States) that Mrs. Grant has visited.
Ireland, France, UK, Mexico, Canada, Norway, Denmark
500
Make a box plot for the following dataset:
Twenty-five randomly selected students were asked the number of movies they watched the previous week. The results are as follows: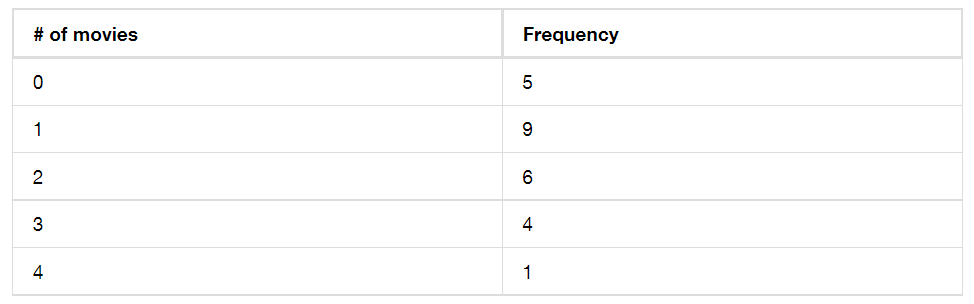
The median is also Q1
500
Find the standard deviation of the following sample:
45,54,76,88,92
STDEV = 20.7
500
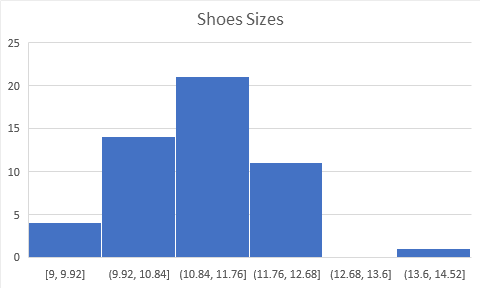
The following data are the shoe sizes of 50 male students. The sizes are discrete data since shoe size is measured in whole and half units only. Construct a histogram and calculate the width of each bar or class interval. Suppose you choose six bars.
9; 9; 9.5; 9.5; 10; 10; 10; 10; 10; 10; 10.5; 10.5; 10.5; 10.5; 10.5; 10.5; 10.5; 10.5
11; 11; 11; 11; 11; 11; 11; 11; 11; 11; 11; 11; 11; 11.5; 11.5; 11.5; 11.5; 11.5; 11.5; 11.5
12; 12; 12; 12; 12; 12; 12; 12.5; 12.5; 12.5; 12.5; 14
500
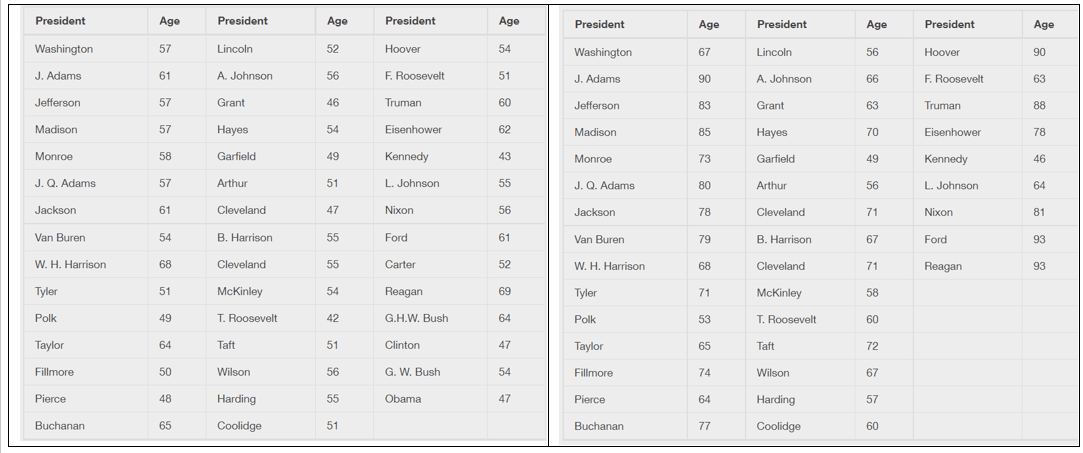
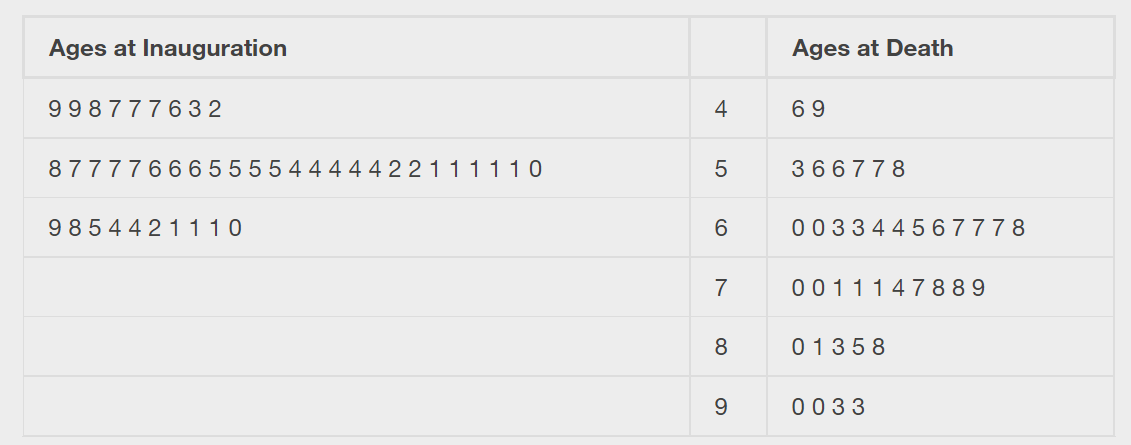
Make a back-to-back Stem and Leaf Plot to show the ages of the President when they were inaugurated, and when they died
500
Find the outliers of the dataset:
6,10,11,14,17,19,22,25,25,26,38,45,60
60 is an outlier
26-14 = 12
12*1.5=25
14-12=2
26+25=51
500
What year did Mrs. Grant graduate high school?
1998