Identify the purpose of tableau dashboards
To display multiple data visualisations in a single screen in a clear manner allowing for monitoring, measuring, and analysation of data
Identify the basic unit of an excel table where data is typed into
A cell
Identify the purpose of a one-to-many relationship is
This means that one record in one table can be related to many records in a different table
Explain the purpose of an interactive filter in a dashboard
Allows for data to be adjusted to fit a range or condition
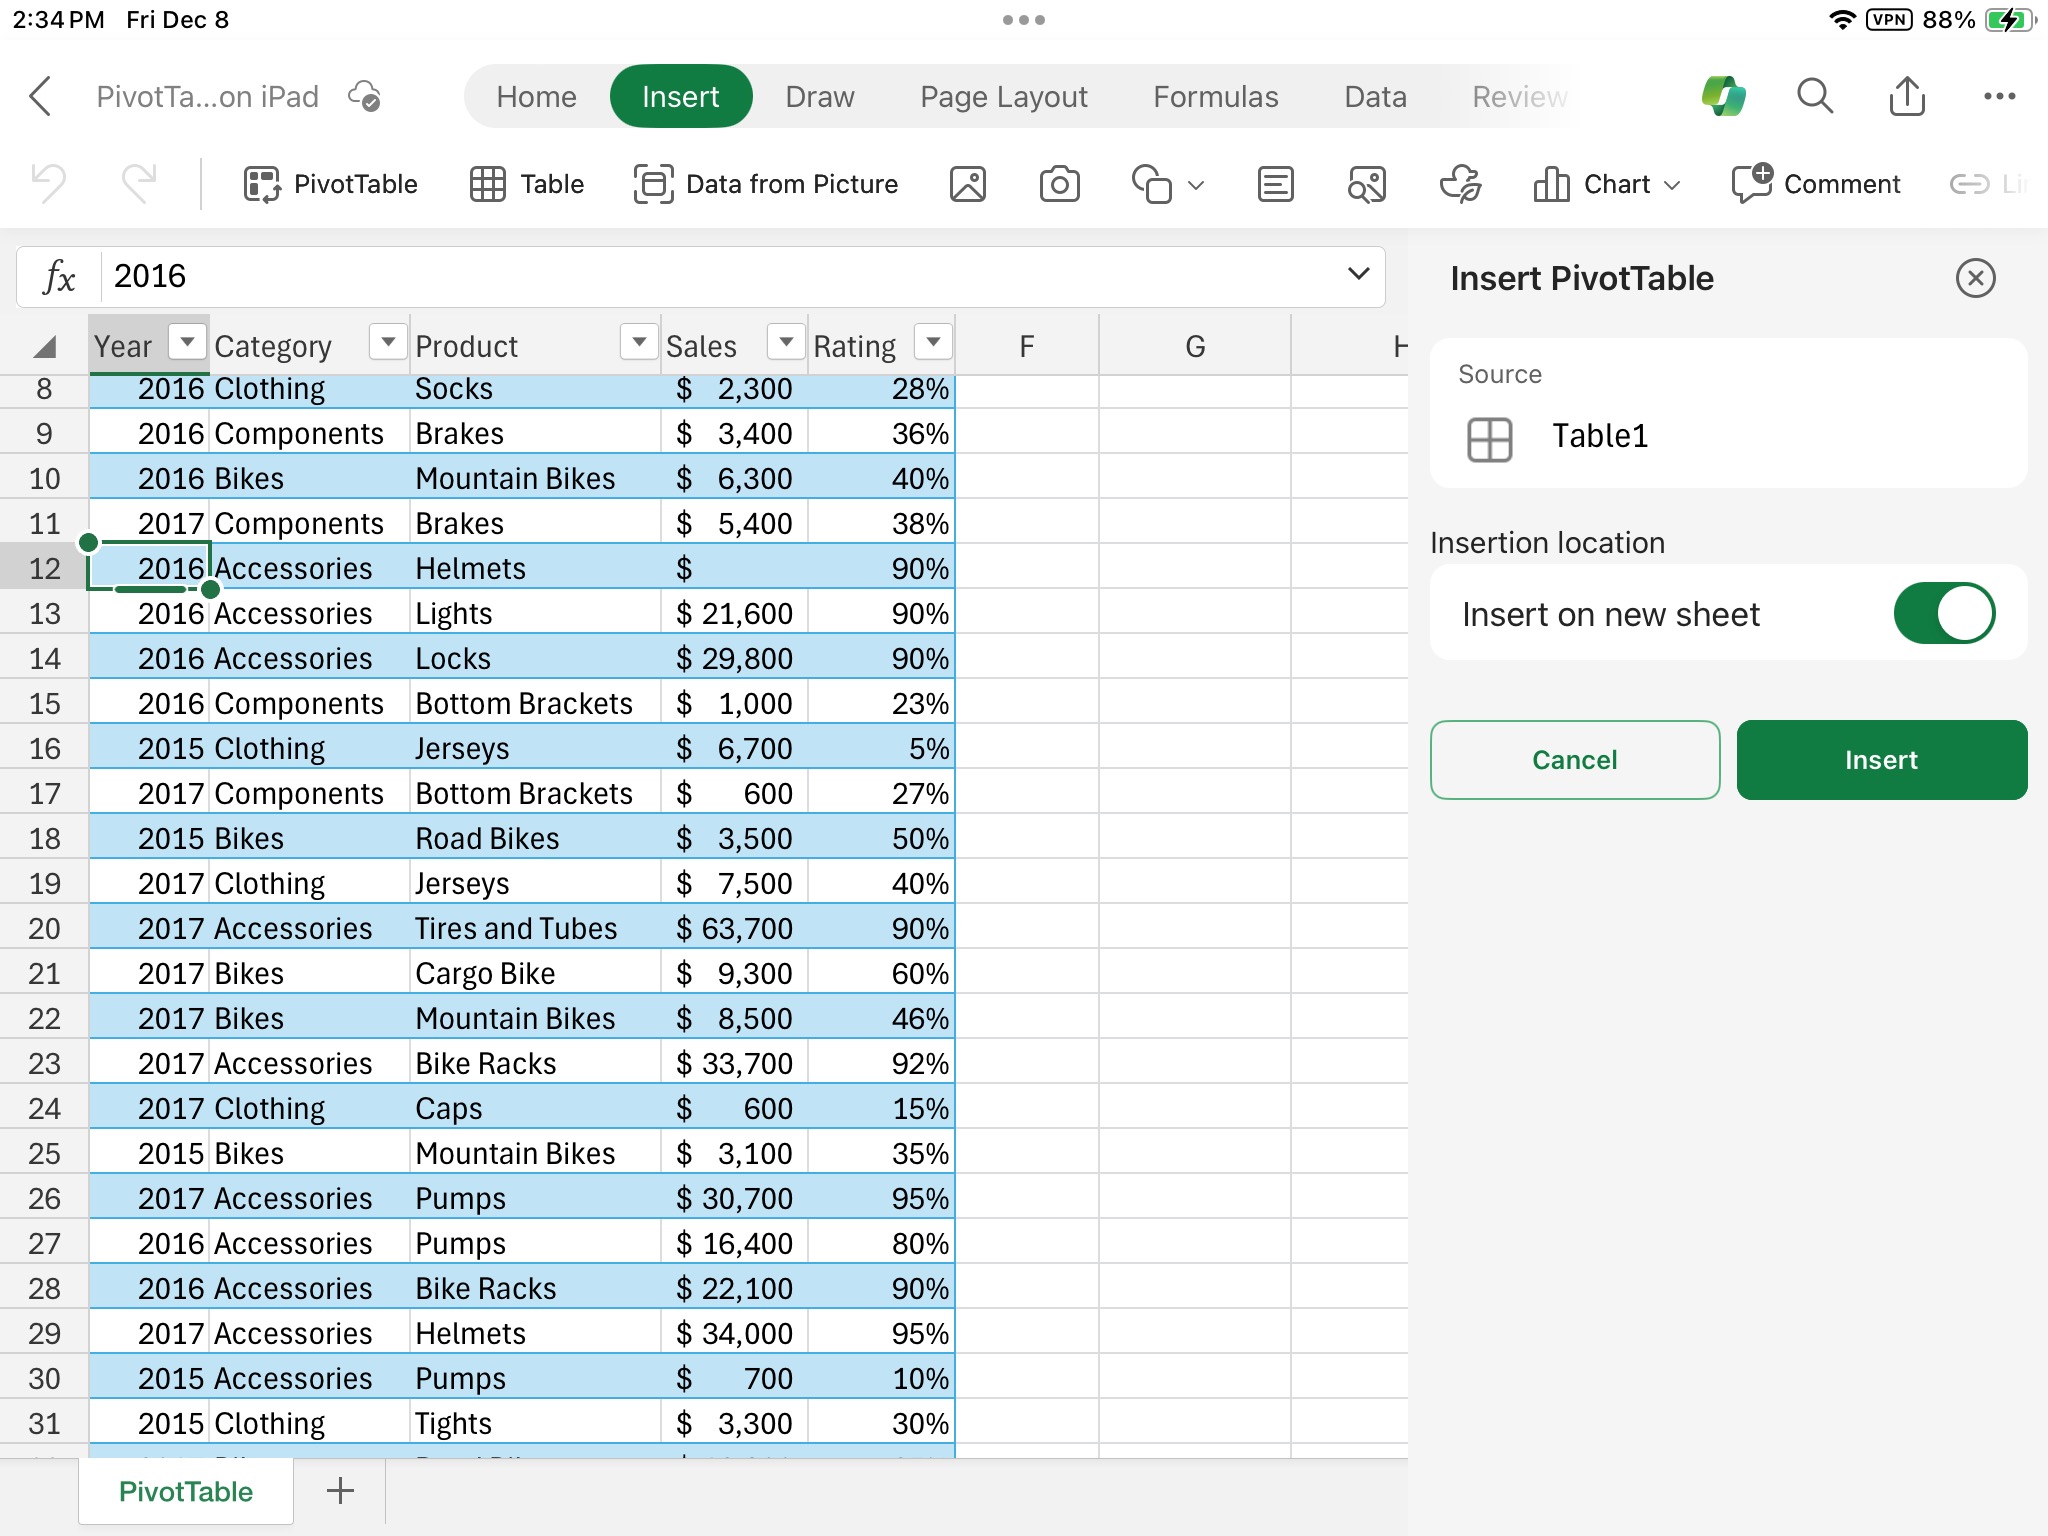
What element is displayed in cell A17
2017
Explain the purpose of a primary key in a database
Primary keys are used to uniquely identify each record in a table
Explain why it is important to pick and stick to a theme in a tableau dashboard
Consistency in colour, fonts, and layout makes the dashboard more professional and easier for users to understand, ensuring the data is the focus and not the design elements
Justify why you would use freeze panes
To keep important titles visible while sorting through data
Justify why tables are used in an excel spreadsheet
Tables organise data into rows and columns, providing a system making it easier to store, search, and manage large amounts of data
Justify why it is important to keep a tableau dashboard simple
Simplicity in dashboards allows for clarity with information and avoids overwhelming the audience with too much information
Compare the sort and filter options in excel
The sort option arranges data in a specific order while filter hides data that does not meet a certain criteria
Define a query
A query is used to retrieve specific data from the database based on certain criteria or conditions