Creating Focus
Measure and Analyze
Improve
Future State and Change
Head Shots
Acronyms and charts
100
A document either given to the team on day 1 or created on day1, it's used to create alignment between the team and the sponsor and could include: team members, process boundaries, problem statement, and approach being used to work on the initiative.
What is a project charter
100
This is the sample size rule of thumb for continuous data at a 95% confidence level. We're looking for the number of data points to collect.
What is 30 or more data points
100
A group based technique for idea generation that could be called "cranium turbulence"
What is brainstorming
100
Visual job aids, SOP's, and documentation are ways to help get this
What is standard work or standardization
100
 This thought leader associated with coining the Term "Lean Thinking" after writing the best selling book about continuous improvement at Toyota called "The Machine that Changed the World"
Who is: Jim Womack
100
A structured interviewing approach of key stakeholder groups; not as popular in Kaizen events because the key stakeholder group(s) are all of the team members
What is Voice of Customer (VOC) interviews
200
Kaizen events focus on visually identifiable waste, but DMAIC projects focus in on waste plus these 3 other very impactful process inefficiencies
What is:
1 - Whitespace (or idle time handoffs)
2 - Rework loops (or mistake reduction)
3 - Process variation (upstream, in-process, and downstream)
200
A root cause group facilitation technique, in which the facilitator may need to drill down many times asking "What's causing this?"
What is 5-Why
200
A technique to get solutions or ideas from other peer groups. Be careful and schedule these activities early in Define or Measure
What is benchmarking or best practice tours
200
It's the change model equation that Maier used to describe the importance that BOTH:
a technically robust solution, or a quality solution
AND
User acceptance and buy-in have on
the effective business result
What is the equation:
QxA=E
200
Some consider him the father of Six Sigma and applying statistical thinking to process improvement; He would say there's too much variation in this statement!

W. E. Deming
200
The acronym given to key variables that affect process performance. They are are often ID'd in the Define phase and Measured in the Measure phase.
What are CTQ's (critical to quality) variables
300
There are 5 of these "intelligent" attributes of a goal statement
What is: Specific, Measurable, Attainable, Relevant, and Time element
(SMART Goals)
Performance-based stretch goals describe the current state, future state, and timing needed to get to the Solution Implementation Plan
300
A root cause analysis technique that compares extremes to the average, or minimum to maximum, and is extremely effective when there is a large amount of spread in the data sets being examined
What is PVA (process variation analysis)
300
Translated it means mistake-proofing
What is Poka-Yoke
300
Often mislabeled as a root cause, this activity is always important for standardizing and making sure everyone understands how to do the new, better way of future state.
What is training associated with the new process and new way of performing work.
300
He is the author of "Our Iceberg is Melting" and an internationally recognized researcher in the field of Organizational Change Management
Who is Dr. John Kotter
300
This charting tool uses the "80/20" rule
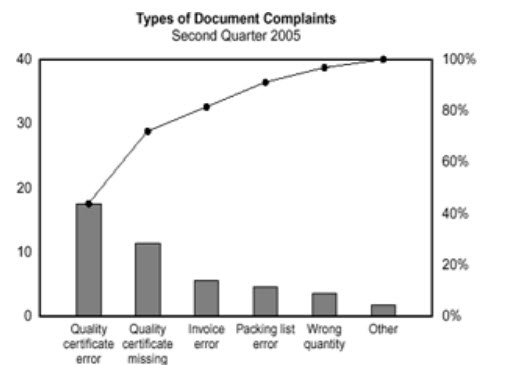
What is a Pareto chart or diagram
400
Before going out and collecting data, a process improvement team should perform this activity so they don't end up with bad, missing, incomplete, and inaccurate data
What is build a data collection/measurement plan
400
When "shifting and skinny-ing" what are we trying to move when shifting?
The central tendency or average or mean of the process performance metric
400
A decision scoring matrix used to evaluate possible solutions and is used to reduce a large list of possible solutions to a manageable few
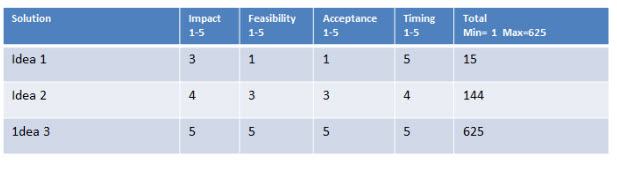
What is an IFAT matrix
400
A time-series chart often used to measure future state performance; it doesn't contain control lines.
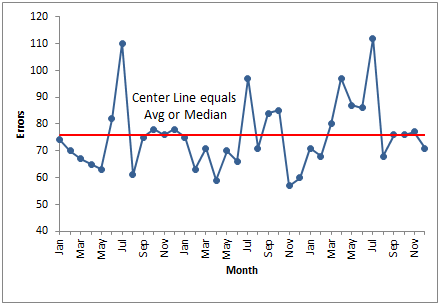
What is a run chart.
400
He was an industrial engineer at Toyota and developed the 7/8 Lean Waste categories
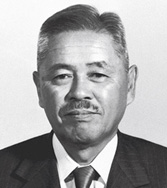
Who is Taiichi Ohno
400
A data review/analysis technique and charting tool that helps to see the central tendency and the amount of variation in a data set.
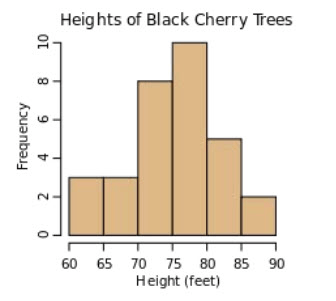
What is a histogram
500
At the end of the Measure Phase three things are needed for effective root cause analysis: Two of them are:
1.) Current state data (qualitative and/or quantitative)
2.) A knowledgeable team/group
The third is to have a few of these...
What are process "focus areas"
500
This type of data frequently has the value "Yes/No, in/out, pass/fail" and we need to collect 1400 or more data points to be 95% confident that we understand what's happening in current state
What is discrete data
500
A technique used to identify and reduce risks in a possible solution
What is Quick FMEA (failure modes and effects analysis)
500
Don't forget to perform this team event after the project is complete - I bring them in by offering cake!
What is a lessons learned exercise followed by recognition/celebration (either is acceptable)
500
He was an industrial engineer at Toyota that help to develop the Kaizen Event Methodology
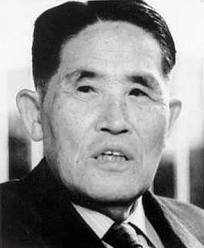
Who was Shigeo Shingo
500
It's used for grouping issues or root causes and takes on many names, the name that refers to it's inventor is the name we want.
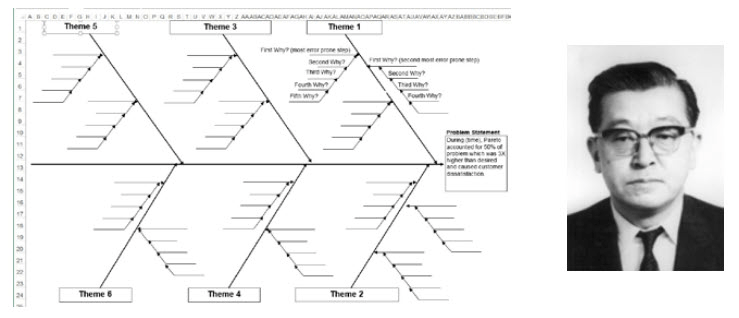
What is an: Ishikawa diagram
(fishbone diagram or cause and effect diagram would also be acceptable)