Dot Plot
Interpret the data
100
What do the dots represent?
Rating of Internet Cats
100
What is the mode of the data?
Number of Kunafas sold last week:
Monday Tuesday Wednesday Thursday Friday
12 10 10 11 10
10
200

How many people were surveyed?
50 people
200
Find range of the data.
12, 20, 12, 13, 14, 18, 10
20 - 10 = 10
300
What is the range?
9
300
A school played 10 football games and won the following points.
2, 4, 4, 5, 2, 3, 4, 5, 5, 1
What is the mode of the data?
4 and 5
400
What is the mode?
10
400
The height of the plants at Ms. Neena's house in inches is:
4, 9, 3, 4, 3, 5
find the outlier.
9
500
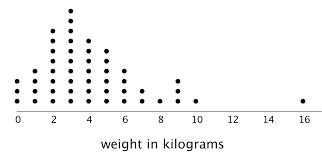
What is the outlier?
16
500
Find the mode, range, and outlier of the following data:
Age of the students participating in the Math Quiz -
12 yrs, 13 yrs, 13 yrs, 12 yrs, 14 yrs, 13 yrs, 18 yrs.
Mode: 13 yrs
Range = 18 - 12 = 6
Outlier = 18