The Process of Science
Graphs
ESRT
Math
Definitions
100
What is wrong with this calculation?
In science, we don't leave things in fractions, and we don't use a bar
---> Round
100
Describe the general trend of this graph.
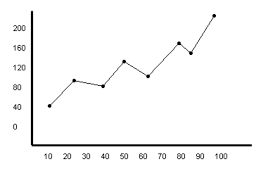
Increasing over time.
100
What is the density of water?
1.0 g/cm3
100
How would you find the volume of a cubic sample?
Multiply all side lengths together
100
Using senses to take measurements or record information
Observation
200
Give two reasons why lab safety is important.
You could hurt yourself or others.
You could damage your experiment.
You could damage equipment.
200
What would the rate of change of this graph tell you information about?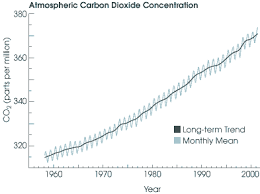
Change in atmospheric CO2 over time.
200
Give all possible units for temperature.
degrees Celsius (°C)
degrees Fahrenheit (°F)
Kelvin (K)
200
In the metric system, what do the different prefixes mean?
(Ex: kilometer, centimeter, millimeter)
they refer to factors of ten differences between units
(Ex: 1 kilometer = 1,000 meters)
200
The amount of heat energy in an object
Temperature
300
How would you find the volume of a randomly shaped rock sample?
Use a graduated cylinder filled with water. Measure the volume before, then after submerging the sample. The difference is the volume of the sample.
300
What type of graph would be best for representing this data?
Bar graph
300
The equation for rate of change reads
"rate of change" = "change in value"/"time"
What does "value" mean in this equation?
Whatever the thing you are finding the rate of change of
300
An object with a density of 6.0 g/cm3 is cut in half. What is the density of one of the new samples?
6.0 g/cm3
Density is the same for any object made of the same material.
300
The amount of matter in a certain amount of space
Density
400
A student measures how the changing speed of a stream affects the size of sediments it can carry.
In this experiment, what is the independent variable?
Speed of the stream (this is the thing you are controlling)
400
What is wrong with this graph?
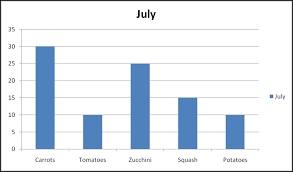
The y-axis has no label.
400
What is 1 mL converted into cubic centimeters?
1 mL = 1 cm3
400
An object has a mass of 3.0 grams and a density of 6.0 g/cm3. What is the volume of this object?
"density" = "mass" / "volume"
(6.0 "g/cm"^3) = (3.0 "g")/"volume"
"volume" = (3.0 "g")/(6.0 "g/cm"^3)
"volume" = 0.5 "cm"^3
400
The amount of "stuff" in an object
Mass
500
Why do scientists classify things?
to make them easier to study and understand
500
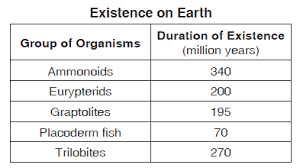
What types of data are best represented by pie graphs?
Percentages, or parts of a whole
500
An object has a density of 3.2 g/cm3. Will this object float in water? How would you know?
It will sink--it is denser than water. The density of water is on the ESRT.
500
If you found the slope of this graph, what would the units be?
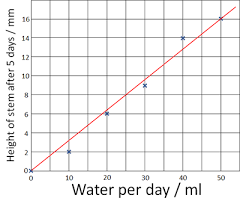
mm/mL
500
All the rocky, solid parts of the Earth
Lithosphere