A negative externality is shown to the _________ of the demand curve.
left
A good/service is __________ if a person can be prevented from using it.
excludable
How many buyers and sellers are in a perfectly competitive market?
many
If there's only one water provider in Fayetteville, can they charge whatever price they choose?
yes; but only to a certain point, because it still has to match up with the demand curve
What would the government do in the case of a positive externality?
They would subsidize the production of that good.
It's the 4th of July and Katherine doesn't want to buy tickets to see the firework show. However, she can see the firework show from far away. What is Katherine?
Katherine is a free rider
Can firms freely enter and exit a perfectly competitive market?
yes, easy to do
In a monopoly, MR _________ when you increase output.
decreases
DWL exists in the case of which externality?
both
Draw the 2x2 table that shows all four types of goods and whether they are excludable and/or rival in consumption.

TR = 50
explicit costs = 30
implicit costs = 10
economic profit = ?
accounting profit = ?
economic profit = 50 - 30 - 10 = 10
accounting profit = 50 - 30 = 20
Can monopolies still experience dead weight loss (DWL)?
yes
A local factory is producing pollution in a small town. Show the externality effect on a graph and the area of tax or subsidy.

Explain the relationship between the Production Function and the Total Cost Function. (which one levels out, which one increases exponentially, why?)
PF: levels out because at some point, there will be too many workers/inputs that there is barely any marginal output
TC: increases exponentially because the PF shows you can barely increase output anymore and it becomes too costly to try to do so
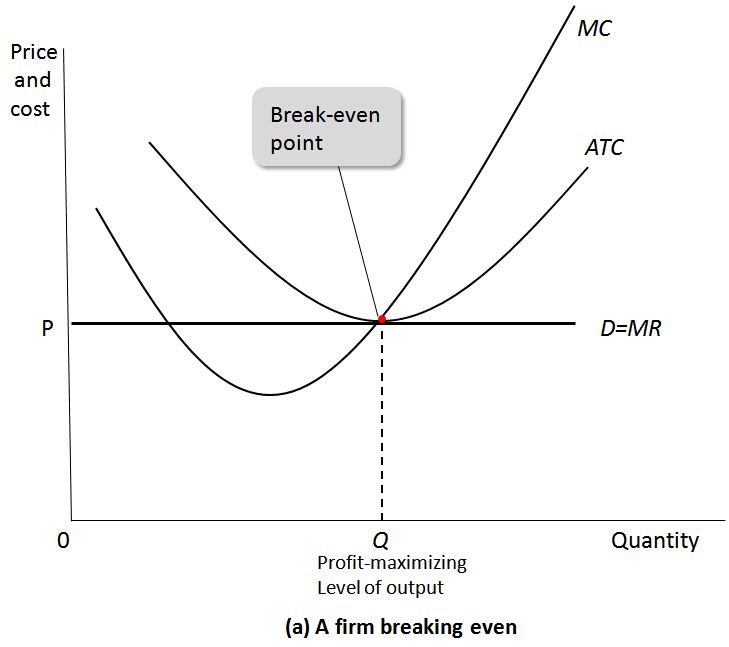
Graph a firm experiencing profit.
Show: profit maximizing point and profit.
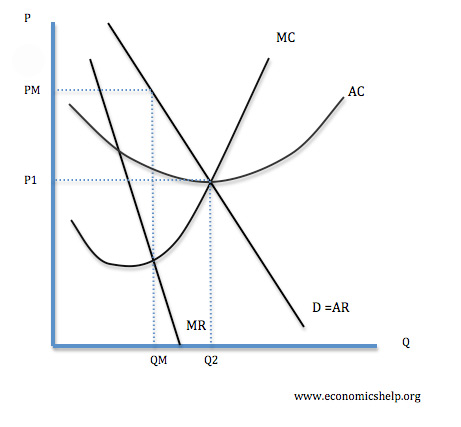
Graph a monopoly.

Sofia pays Sam $50 to mow her lawn every week. When the government levies a mowing tax of $10 on Sam, he raises his price to $60. Sofia continues to hire him at the higher price. What is the change in PS and CS?
Graph all four cost curves: MC, ATC, AVC, and AFC.

Graph a firm experiencing a loss.
Show: the profit maximizing point, TR, TC, and loss.

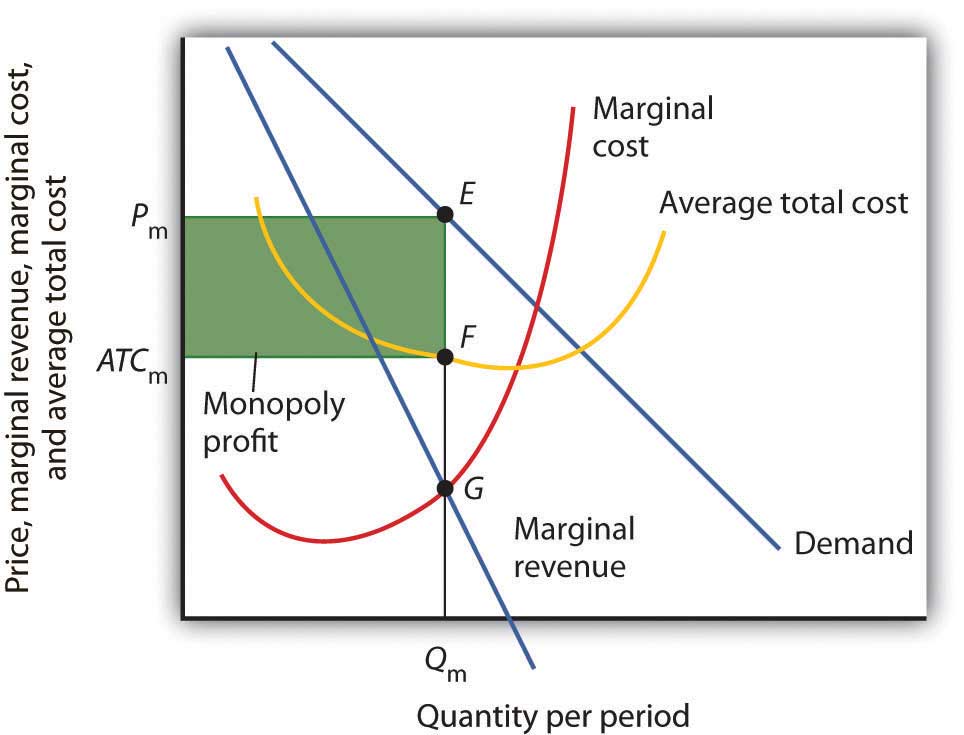
Graph a monopoly and show where profit is.

