A & P
EKG parts
EKG Leads
ACS
CHF
100
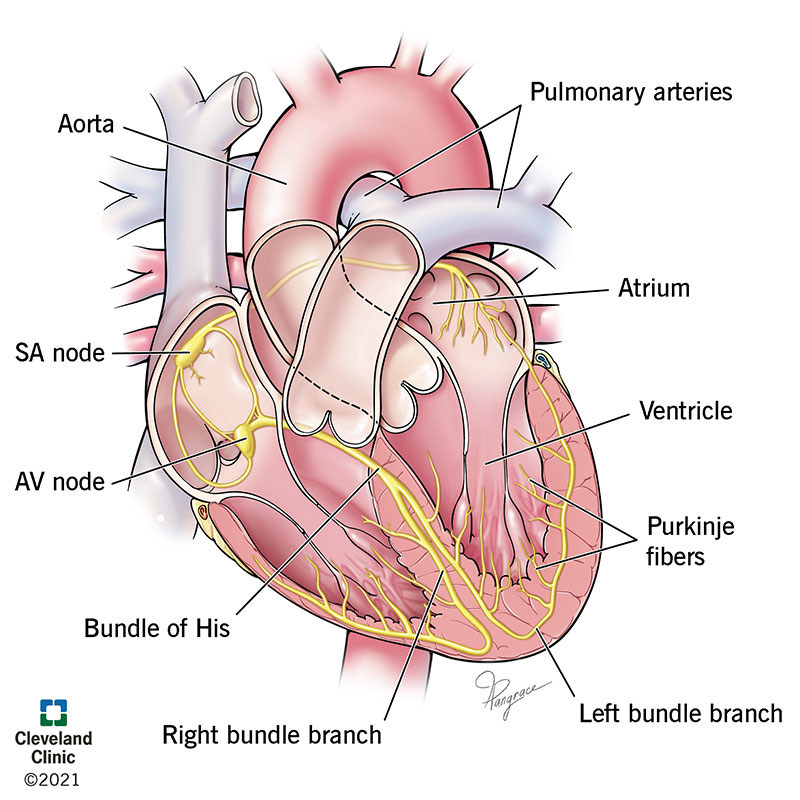
Primary Pacemakers in the heart
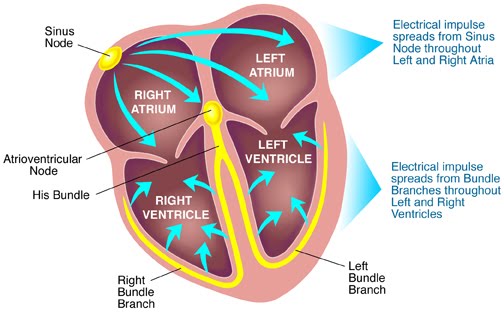
SA node
AV node
100
Movement towards an EKG lead causes this to happen on the EKG paper.
Positive deflection. 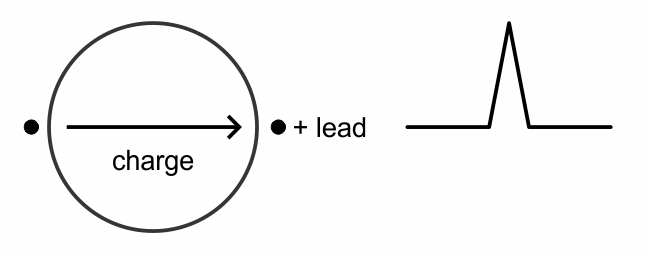
100
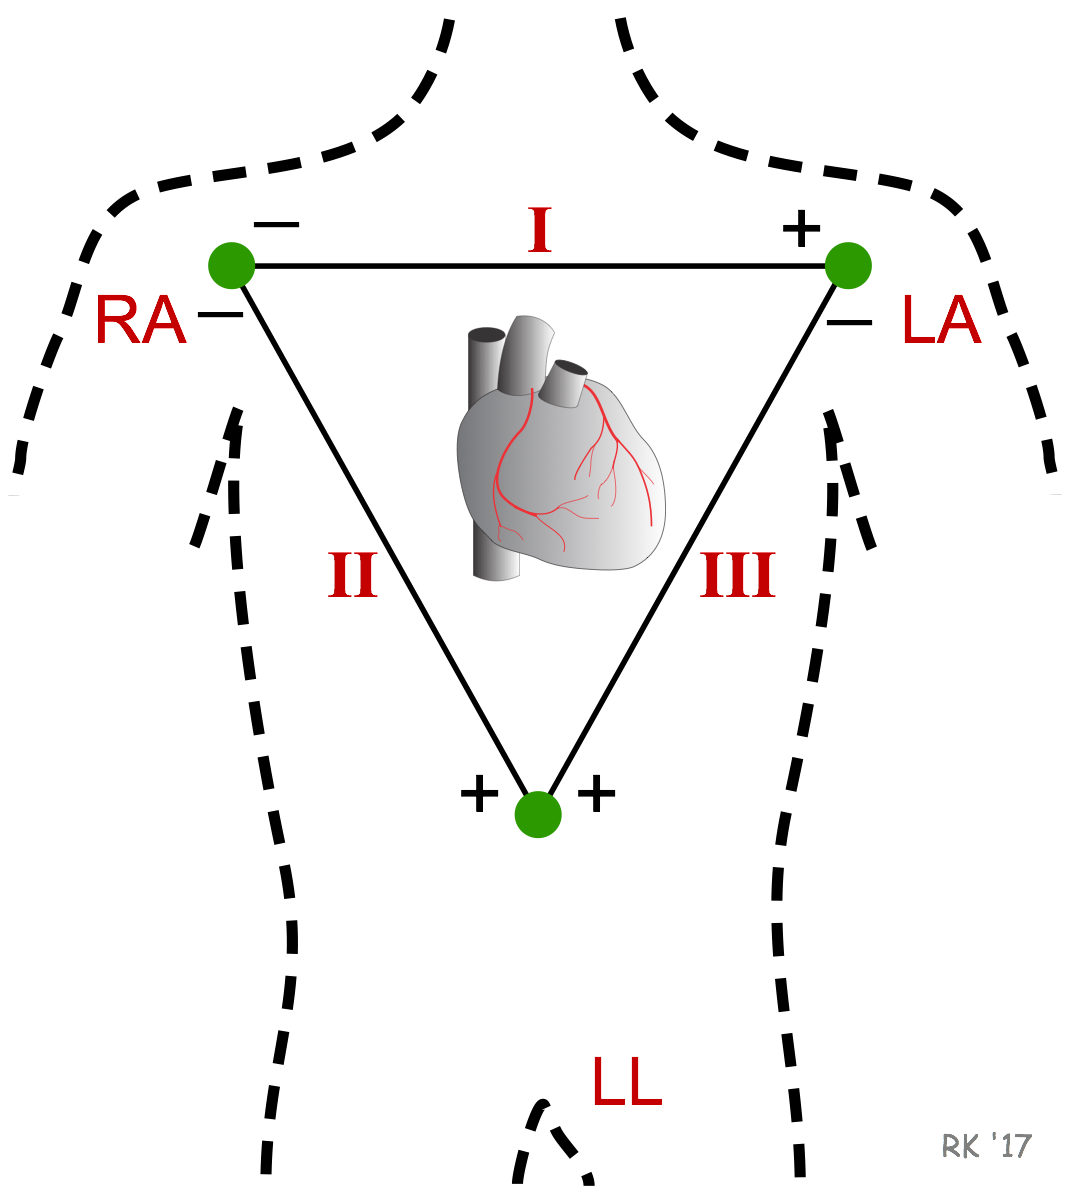
The standard limb leads (I,II,III) Look at what?
Lead I: Left high lateral wall
Lead II: Inferior wall
Lead III: Inferior wall
100
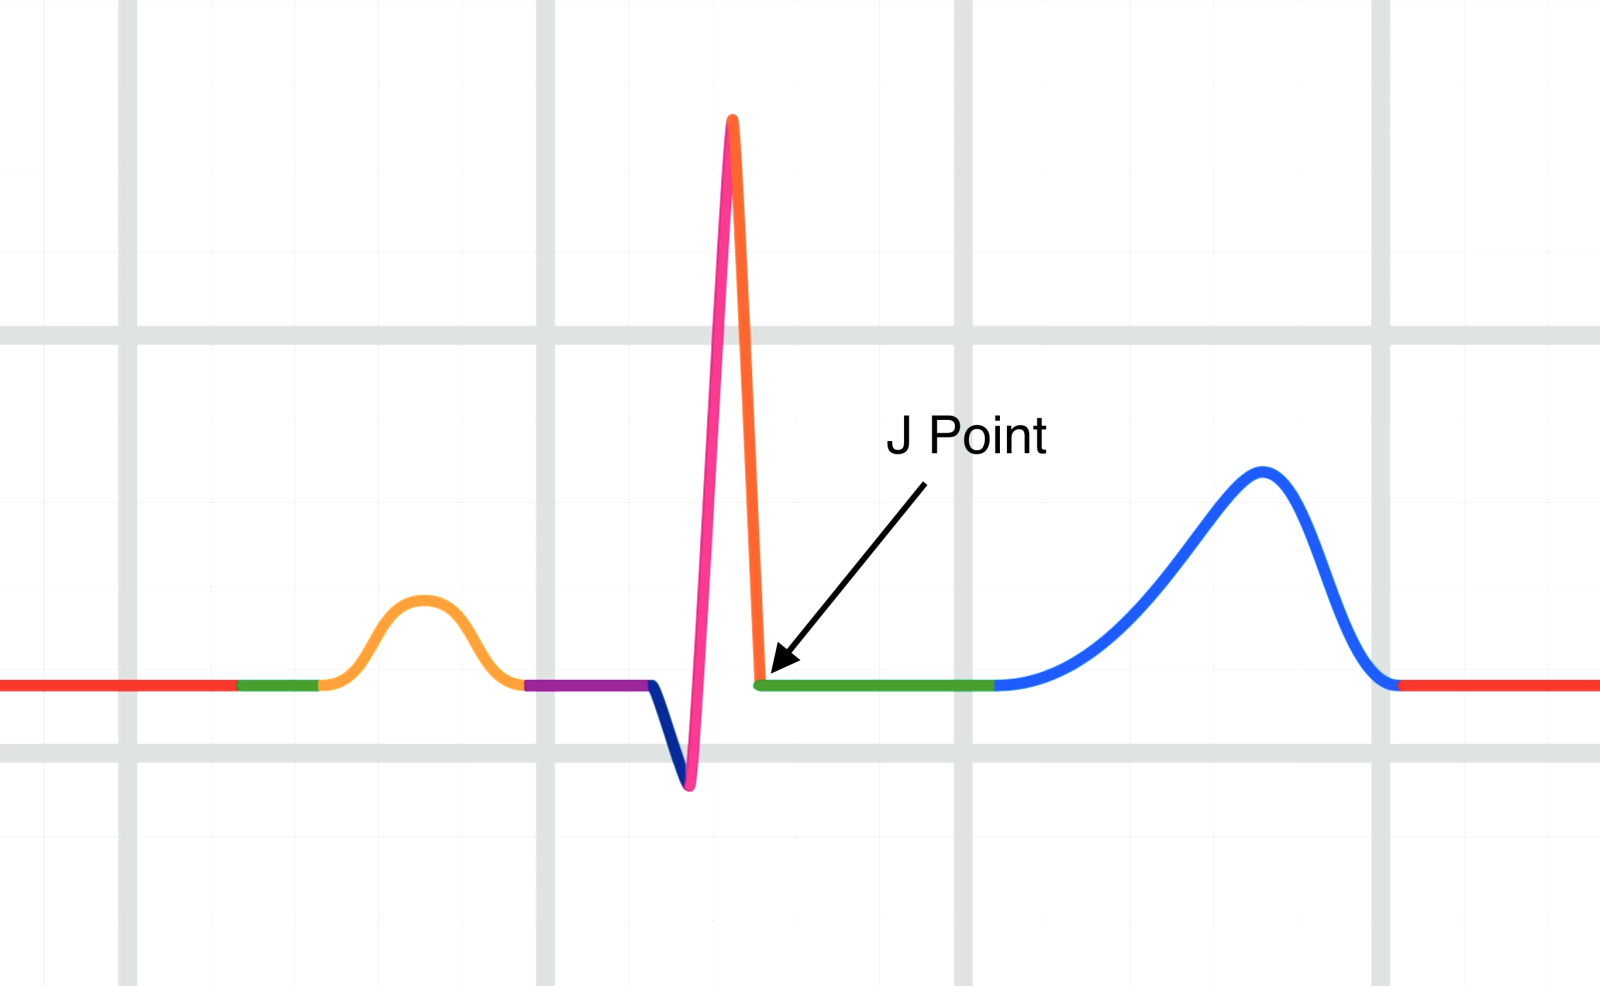
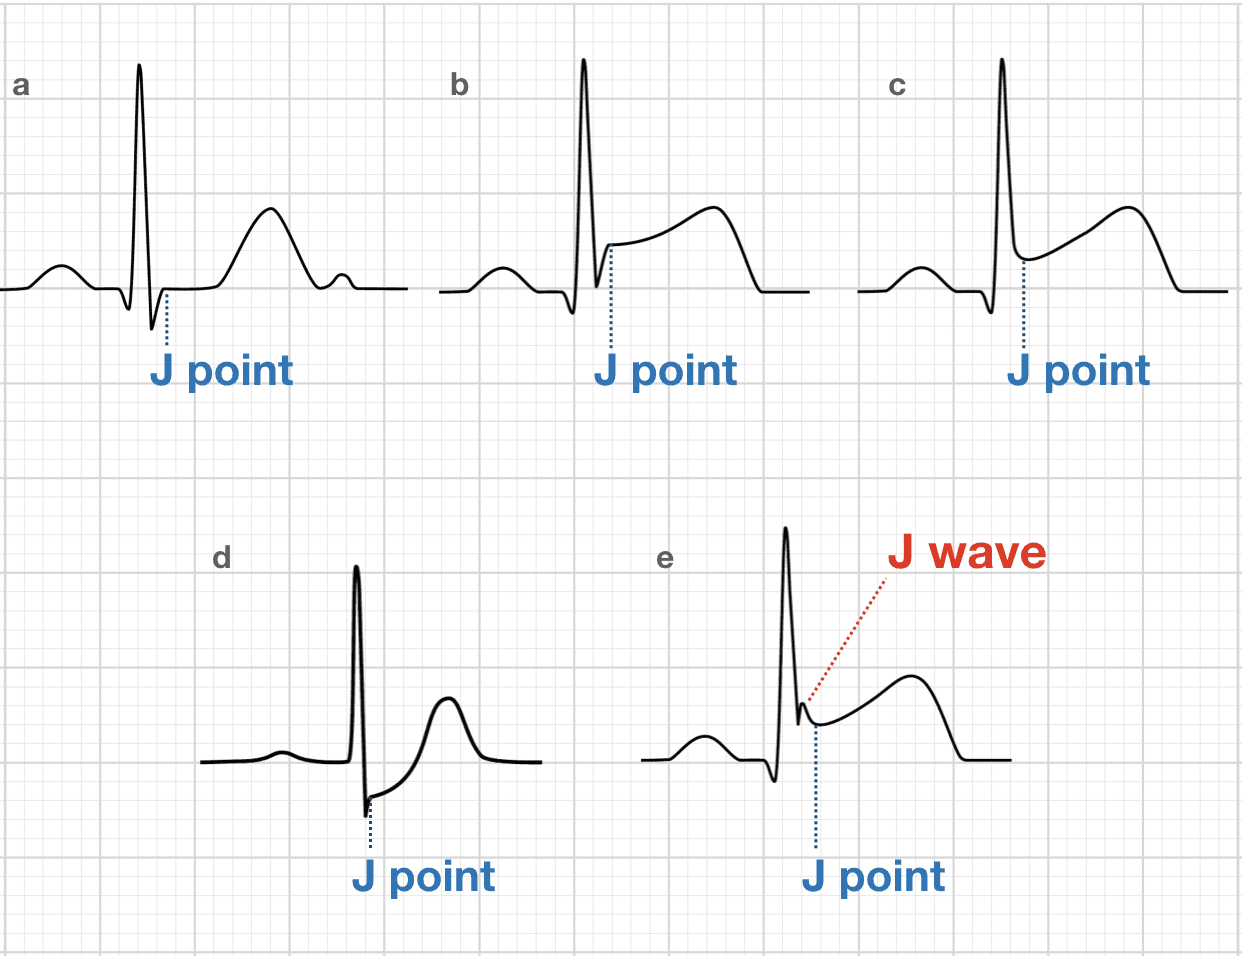
This is the junction between the termination of the ARS complex and the beginning of the ST segment.
J-Point.
100
Heart failure results from ANY disorder that causes.
1.____________
AND / OR
2.____________
1. Reduces myocardial contractility (Can't pump)(Systolic dysfunciton)
Normal EF = 55-70%
Systole = Emptying
Diastole = Filling
2. Reduces ventricular filling (Diastolic dysfunction) (Can't Fill)

200
These are primary cardiac electrolytes / ions inside and outside of cardiac cells used to develop electricity.
Sodium Na+
Potassium K+
Calcium Ca++
200
This portion of the EKG represents atrial depolarization.
P Wave
200
The augmented limb leads (aVR, aVL, aVF), look at what?
aVR: Right high lateral wall
aVL: Left high lateral wall
aVF: Inferior wall

200
We evaluate the J-point and ST segment for these things.
Elevation (MI)
Depression (Ischemia)
Notching and J-waves (BER and Hypothermia).
200
This definition is the mechanical function of the heart.
The amount of blood pumped out during systole.
Stroke Volume.
Must have normal heart structure and adequate filling of the cardiac chambers.
300
This is defined as the movement of sodium ions across the cell membrane, changing the electrical potential of the cell to positive, leading to cardiac contraction.
Depolarization. Conduction cycle phase "0"
300
This portion of the EKG represents electrical conduction through the AV Junction.
PR Interval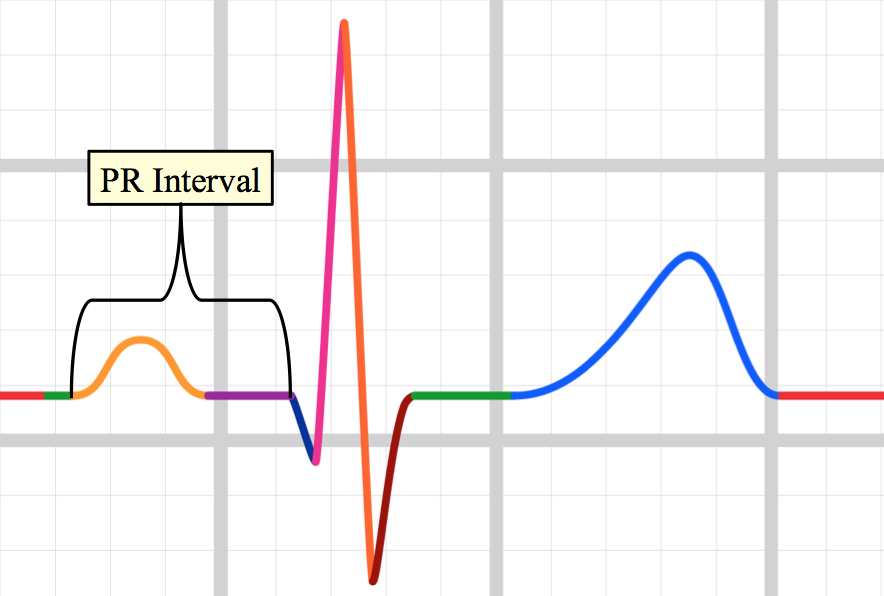
300
The precordial leads (V1-V6) look at what?
V1-V2: Septum
V3-V4: Anterior wall
V5-V6: Lateral wall

300
Infarction / Ischemia causes depolarization and repolarization changes in the dead/dying tissues, causing WHAT 3 EKG changes?
ST segment changes
T Wave changes
Pathologic Q waves

300
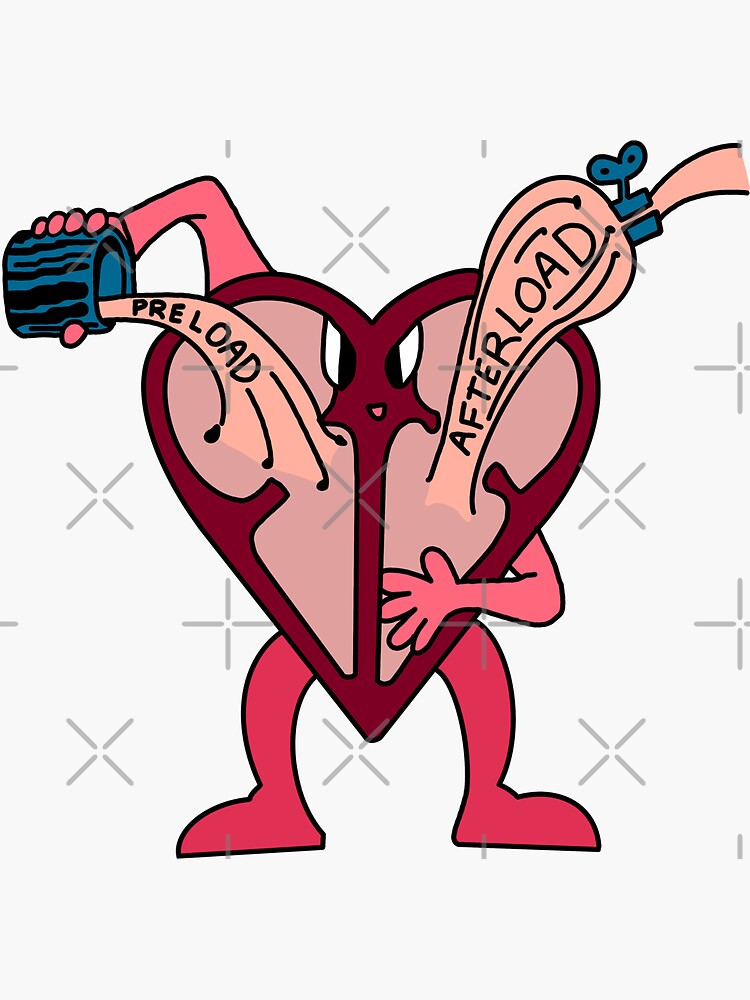
This is the pressure that the ventricles must contract against to eject blood.
This is the amount of blood stretching the myocardial cells just prior to contraction
Afterload
Preload
400
This is defined as the movement of ions until the cardiac cell is more NEGATIVE, and at its resting negative potential (Ready for another cardiac contraction)
Repolarization
400
This portion of the EKG represents ventricular depolarization.
QRS Complex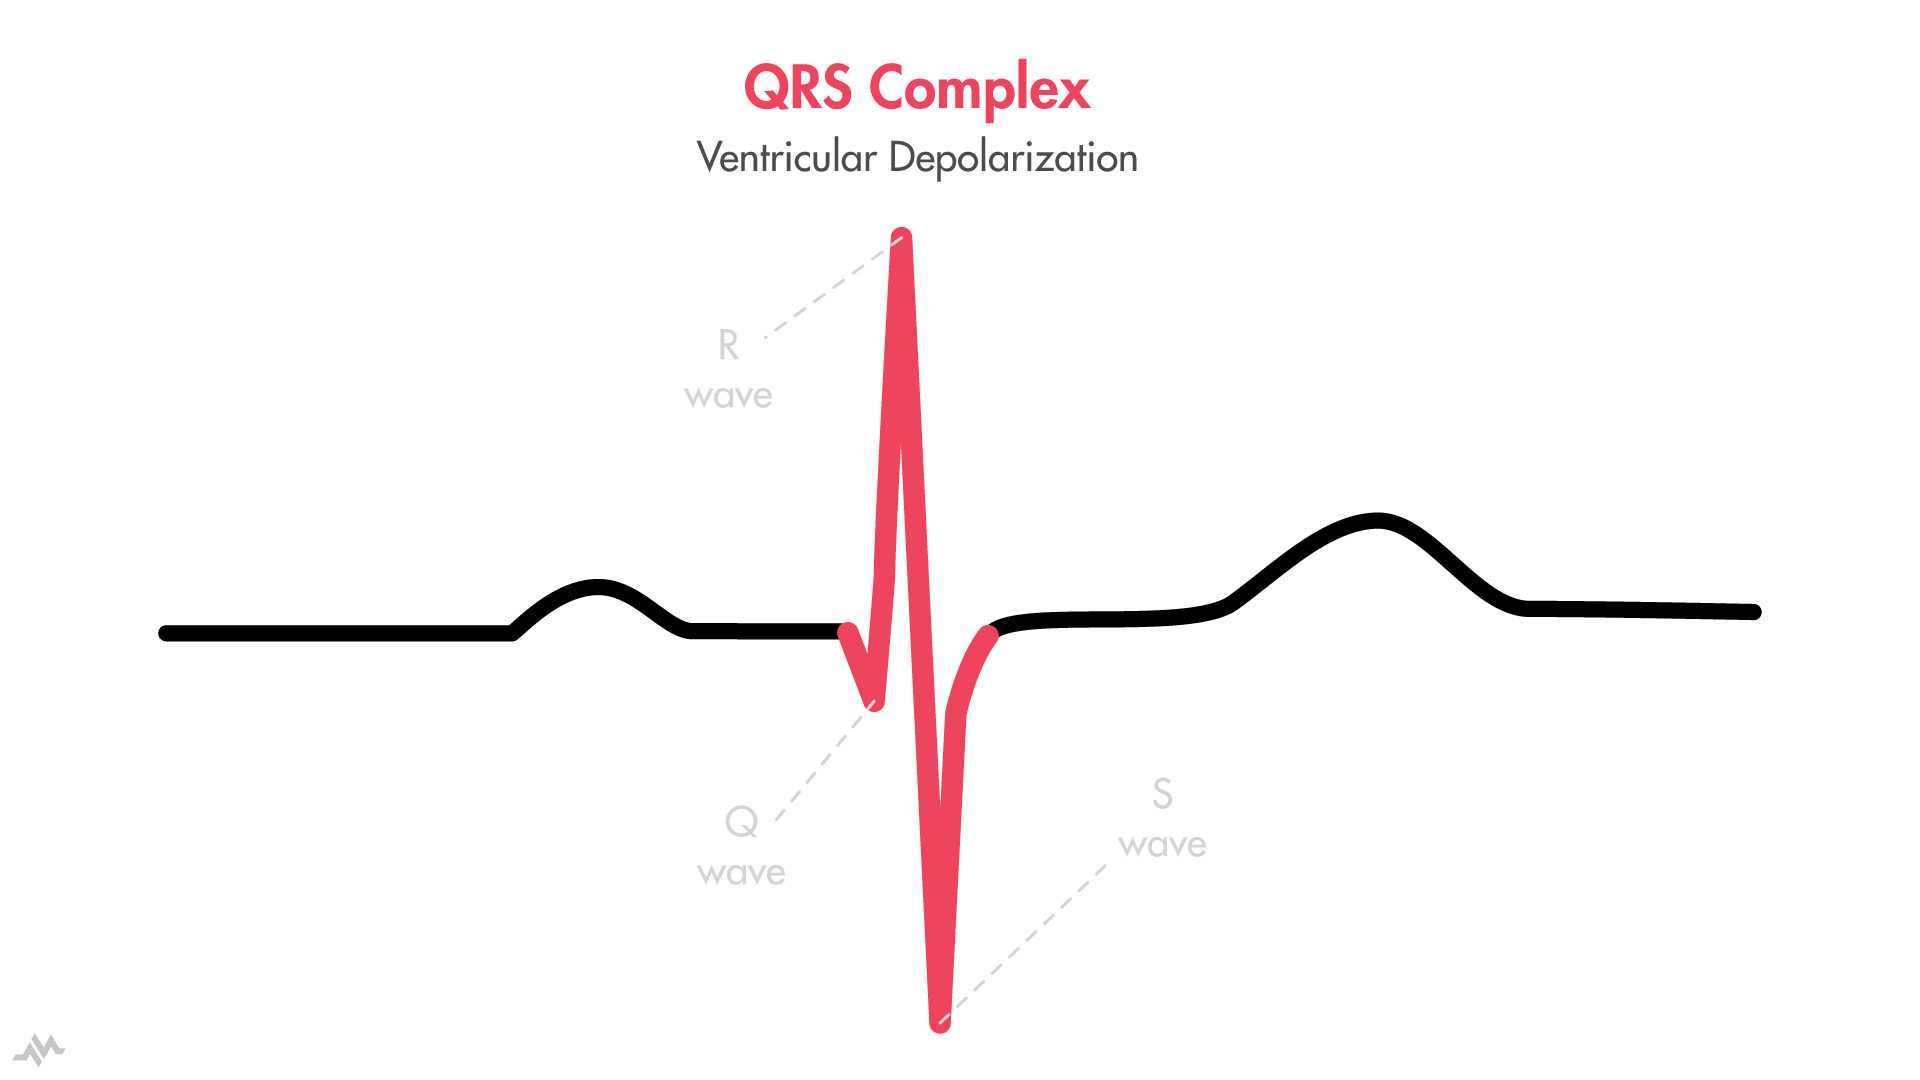
400
These EKG leads look at the right side of the heart
V1, V2, V3
aVR Right high lateral
(Not a view of the right ventrical.
400
When measuring for ST segment elevation / depression, "what" do we base our measurement off of?
T-P Segment.
Time between the end of the T wave and prior to the P wave.
400
Systemic Vascular Resistance (SVR)(force that the body's vasculature exerts on circulating blood) CAUSES hypertention.
What ventricle is effected by Hypertension?
What happens to afterload with increased SVR?
Left ventricle is affected.
Afterload is Increased.
500
The cardiac conduction system is comprised of these five areas.
SA Node, AV Node, Bundle of HIS, Bundle Branches, Purkinje Fibers.
500
This EKG portion is the time BETWEEN ventricular depolarization and repolarization.
ST Segment
500
These ekg leads look at the inferior side of the heart
II
III
aVF
500
if "this" shape is present in ST elevation, it is more likely that the patient is truly having an MI.
Convex shape. 
500
increased "Pulmonary vascular resistance" (Left ventricular failure, Chronic hypoxia, PE).
What ventricle is affected?
What happens to afterload?
Right ventricle
Increased afterload.
600
This phase of the heartbeat is when the heart muscle contracts and pumps blood from the chambers into the arteries.
Systole:max_bytes(150000):strip_icc()/cardiac_cycle-597a5d8168e1a200115e5937.jpg)
600
This portion of the EKG represents ventricular repolarization
T Wave
600
These leads look at the left side of the heart.
V5
V6
I
aVL
600
These types of T-waves are broad and asymmetrically large.
And indicative of early MI, prior to ST elevation & Q waves
Hyperacute T waves
600
Increased afterload causes heart muscle to?
Causing?
Work harder to overcome the constricted vasculature.
Become hypertrophied or Dilated.
Hypertrohied = Threw a bunch of springs on top of a trampoline and it didn't increase the bounciness.
Dilated = The springs are all stretched out and aren't as bouncy anymore.

700
This portion of the EKG is the total time for ventricular Depolarization AND repolarization
QT interval
700
These leads look at the posterior of the heart
Opposite of V1-V2
700
ST Elevation MI Evolution.
EKG Findings for answer
1. Before Injury
2. Ischemia
3. Infarction
4. Fibrosis
1. Normal EKG / Baseline
2. ST Depression, Hyperacute T waves, T wave inversions
3. ST elevation, Q waves appear
4. ST segment returnes to baseline, Q Waves persist.
