Two Way Frequency Tables
Relative Frequency
Box Plots and Dot Plots
Categorical Vs Numerical
1-Variable Statistics
100
In Table 1, how many students are in 9th grade and take the bus?
93 students
100
In Table 3, what is the relative frequency of people younger than 30 who are early birds?
22% or .22
100
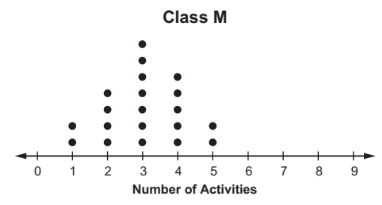 What is the median of this data set?
3
100
How many pets a family owns
Numerical
100
3 6 8 8 9 11 13 13 39
Is there an outlier? Which number?
39
200
In Table 1, how many students walked to school?
97 students
200
Use Table 1 to calculate the relative frequency of students who take the bus.
259/556 = 46.6% or .466
200
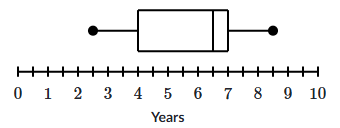
How much of the data set is less than 6.5?
50% (6.5 is the median, which divides the data in two halves)
200
The color produced by igniting fireworks containing different elements
Categorical
200
Free Space
Free Space
300
In Table 2, how many students own a car but NOT a drivers license?
4 students
300
Use Table 2 to calculate the relative frequency of students with a drivers license but no car.
24/100 = 24% or .24
300
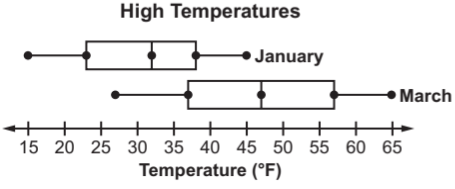
Which month had a greater variation in its daily temperatures?
March (spread farther out)
300
The weight of a desk
Numerical
300
22 23 24 24 24 25 27 31 34
Calculate the mean.
mean = 26
400
In Table 3, how many people were surveyed?
50 people
400
What percentage of people 30 years or older are night owls in Table 3?
.32/.54 = 59.3% of people 30 years or older
400
Describe the shape of the data set shown.
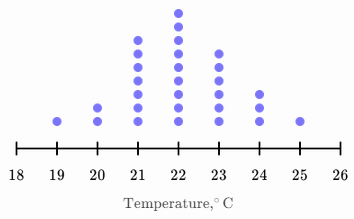
Nearly (or approximately) symmetric as opposed to skewed right or left
400
You touch a pot of boiling water. It feels hot.
Categorical (would be numerical if you said it feels like 200 degrees)
400
2 2 4 5 5 6 7 7 8 9 10
Find the median.
Median = 6
500
In Table 2, what numbers belong in the four blanks? You can write them in any order as long as you have all four numbers.
4, 24, 33, 53
500
In Table 3, is there an association between being a early bird and being 30 years or older? What percentages did you compare?
% who are early birds: 44%
% 30yrs/older who are early birds:
.22/.52 = 40.7%
Since these are pretty close, there is no association
500
What is the IQR of the data set shown?
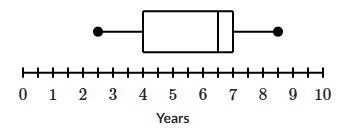
7 - 4 = 3
500
The entry number assigned to a marathon runner
Categorical
500
2 2 4 5 5 6 7 7 8 9 10
Find the IQR.
IQR = 4