Histograms
Measures of Central Tendency P1
Common Tendency: Google Sheets
Variability
Standard Deviation
100
How many lottery winners were between 50-59 years old?

8
100
What is the most common tendency?
Mean
100
You have the following numbers in cells A1 to A6: 5, 7, 5, 8, 9, 5. What Google Sheets function can you use to find the mode of this data?
To find the mode of the data in Google Sheets, you would use the formula:
=MODE(A1:A6)
Given the numbers 5, 7, 5, 8, 9, 5, the mode is 5, because it appears most frequently.
100
Variability tells us what is ________ in a data set
difference, varied
100
What refers to how far each value in a dataset is from the mean, and it's used to describe the spread or variability of the data?
Standard Deviation
200
The numbers on the bottom of a histogram that represent groups of data are called what?
Bins
200
What is the range:
3, 19, 9, 7, 27, 4, 8, 15, 3, 11
27 - 3, or 24
200
You are analyzing test scores for a class of students. Use Google Sheets to find the average score if the scores are: 85, 90, 78, 92, and 88. Which function will you use, and what is the formula?
=AVERAGE(85, 90, 78, 92, 88)
200
What is used to measure variability, other than average and standard deviation?
Range
200
What Google Sheets function is used to calculate the standard deviation of a dataset?
=STDEV(range)
300
Which Histogram is negatively skewed ?
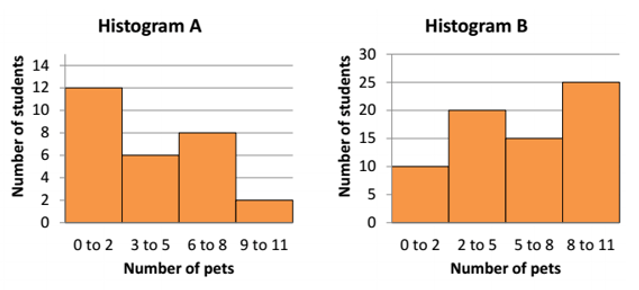
Histogram B
300
Find the Mean:
2,4,6,19,28,28,35,29
18.875
300
A survey asks 20 people about their favorite type of coffee, and the results are recorded in a column. Which Google Sheets function can you use to find the most popular coffee choice, and how would you apply it?
=MODE()
300
Does variability increases or decreases when standard deviation decreases?
Decreases
300
What does a smaller standard deviation (SD) indicate about the mean?
Highly representative, the data points are closer to the mean.
400

How many outliers are shown in this histogram? What are the 3 options on dealing with outliers?
2 outliers
Leave it
Change it to a corrected value
3. Remove it from the dataset (rare)
400

What kind of mode does the histogram above represents?
Multi-modal
400
You want to find the median household income from a dataset of 10 incomes listed in Google Sheets. How would you use Google Sheets to calculate this, and what does the median tell you about the data?
To find the median household income from 10 incomes, use the formula =MEDIAN(A1:A10) where the incomes are listed in cells A1 to A10. The median represents the middle value when the data is arranged in ascending order. If there is an even number of values, the median will be the average of the two middle numbers.
400
What is the function in Google Sheets the calculates the variance of a population when you select a range of cells containing data?
=VARP()
400
To calculate the standard deviation of a dataset, this first step involves finding the average of all the values. What is this step called?
finding the mean
500
Explain why histograms are important in Finance and Business
Allows to quickly identify patterns, trends, outliers, and the overall shape of the data.
500
You are analyzing the incomes of 200 employees. To calculate the average income of employees in departments that have more than 50 employees, which statistical concept would you use?
Conditional mean
500
You have the following dataset of house prices in thousands of dollars: 150, 160, 155, 400, 165, 170, 180, 300, 155, 160.
How would you use Google Sheets to find the median price?
How does the presence of an outlier (400) affect the median, and what is the result?
Use formula =MEDIAN(A1:A10)
Where A1:A10 contains the house prices.
The presence of the outlier (400) does not affect the median much because the median depends on the middle value in the ordered list, not the extremes.
500
Find the variance for population using this formula:

If the heights (in inches) of 5 students in a class are 60, 62, 65, 63, and 64, what is the variance of the population?
2.96
500
You have the following dataset representing the scores of 5 students on a quiz:
85, 90, 92, 88, 87
Question:
Follow the steps below to calculate the standard deviation of the quiz scores:
- Step 1: Calculate the mean (average) of the scores.
- Step 2: Subtract the mean from each score and square the result.
- Step 3: Find the variance by averaging the squared deviations.
- Step 4: Finally, calculate the standard deviation by taking the square root of the variance.
What is the standard deviation of the quiz scores?
Step 1: Mean
Mean = (85 + 90 + 92 + 88 + 87) / 5 = 88.4Step 2: Squared Deviations
(85 - 88.4)² = 11.56
(90 - 88.4)² = 2.56
(92 - 88.4)² = 12.96
(88 - 88.4)² = 0.16
(87 - 88.4)² = 1.96Step 3: Variance
Variance = (11.56 + 2.56 + 12.96 + 0.16 + 1.96) / 5 = 5.84Step 4: Standard Deviation
Standard Deviation = √5.84 ≈ 2.42