Word Problems
Vocab
Graphs
Equations
True or False?
100
Write an exponential growth function to model the situation. A population of 422,000 increases by 12% each year.
What is y = 422000(1.12)^t
100
In the growth model below, what is the initial amount?
y=2000(1+.04)^t
2000
100
Does the graph represent exponential growth, exponential decay, or a linear model? 
Exponential growth
100
Does the equation y = 4x represent exponential growth or exponential decay?
Exponential growth because the base is "4" and that is bigger than 1!
100
In an exponential equation, if the base "b" is bigger than 1, then the graph will display exponential decay.
False! If the base "b" is greater than 1, then it will be exponential growth!
200
A total of 50,000 contestants participate in an Internet online survivor game. The game randomly kills off 20% of the contestants each day.
Write an exponential decay functions that represents the population after t days.
y=50,000(.8)^t
200
In the decay model below, what is the rate(%) of decay?
y=2000(1-.6)^t
60%
200
Does the graph represent exponential growth or exponential decay?
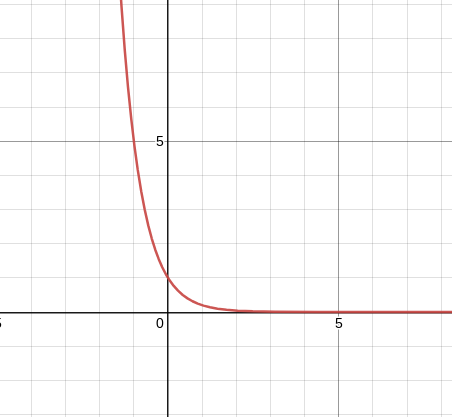
Exponential decay
200
Does the equation y = 0.5x represent exponential growth or exponential decay?
Exponential decay because the base is 0.5 which is smaller than 1!
200
In an exponential equation, if the base "b" is between 0 and 1, then the graph will display exponential decay.
True! If "b" is between 0 and 1, the graph will be an exponential decay graph!
300
The value of a new car is $25,000. The value decreases by 5% each year. Write a function that represents the value of the car after t years.
y=25,000(.95)^t
300
In the growth model below, what is the time in years?
y=75000(1.3)^5
5 years
300
Does the graph represent exponential growth or exponential decay or neither?

Neither (It's a logarithmic function)
300
Does the equation y = 5(2)x represent exponential growth or exponential decay?
Exponential growth because the base is "2" and that is bigger than 1!
300
The value of a car is an example of a situation that would display exponential growth.
False; The value of a car decreases exponentially over time, so it would be exponential decay!
400
At the end of last year, the population of a town was approximately 75,000 people. The population is growing at a rate of 2.4% each year.
Write an exponential growth function that represents the number of contestants after t years.
y=75,000(1.024)^t
400
You must answer BOTH PARTS:
a) Does this model represent growth or decay?
b) In the model below, what is the rate(%)?
y=3500(.75)^t
a) decay
b) 25%
400
Does the graph represent exponential growth, exponential decay, or a linear model? 
Linear Model
400
Does the equation y = 2(0.3)x represent exponential growth or exponential decay?
Exponential decay because the base is "0.3" and that is smaller than 1!
400
The population of NYC is an example of exponential growth
True!