Probability
Hypothesis Testing
Regresssion
Advanced Regression
STATA
100
What is the difference between disjoint and independent probabilities?
Events are considered disjoint if they never occur at the same time; these are also known as mutually exclusive events. Events are considered independent if they are unrelated/the probability of one event occurring does not effect the probability of the other event occurring
100
When do you use a z-score vs a t-score?
Use a z-score when working with proportions and have a sample size >30
Use a t-score when we don't have the population variance or standard deviation or sample <30
100
What does R-squared tell us?
What percent of the variation in Y can be explained by the independent variables we have included
100
When do I use a squared term?
If the relationship between X and Y looks parabolic - nonlinear terms
100
In what circumstances do you put "i." before a variable in a regression code in stata? Hint: there are two circumstances
1. When you are using a categorical variable
2. When you are adding fixed effects
200
What is a probability distribution table?
It provides all the different outcomes and the probability of that outcome occurring.
200
When do you use each equation?
(𝑝1 − 𝑝2)/ sqrt (𝑝𝑡𝑜𝑡𝑎𝑙 ∙ (1 − 𝑝𝑡𝑜𝑡𝑎𝑙)) ∗ ( 1/𝑛1 + 1/𝑛2 )
(Pa-Po)/sqrt (𝑝0 ∙ (1 − 𝑝0))/n
You use the first equation when comparing two sample proportions
You use the second equation when you are comparing a sample proportion to a comparison value/population proportion
200
What is the equation for Beta 1?
Covariance/variance
(Xi-Xmean)(Yi-Ymean)/(Xi-Xmean)2
200
How do I know whether to include a squared term, logged term, or interaction in my regression?
Significant p-value for that coefficient
200
What variable should I cluster in fixed effects if I'm adding fixed effects for more than one variable?
The variable that is not time
300
What is the multiplication rule?
Pr(A and B) = Pr(A|B)*Pr(B)
If the events are independent: Pr(A and B) = Pr(A) * Pr(B)
300
What is the formula for a ttest?
300
What is the equation for the predicted values of each observation? What are the predicted values? provide a brief description
(Yi ) =(β0) +(β1) Xi
This gives y-values based on the regression equation
300
What 2 things do I need to do in order to make a regression account for panel data in stata?
1. i.variable
2. clustered standard errors- , cluster(variable)
300
Write the two different margins commands on the board and explain the difference between the two commands.
Margins, at (variable=(min(increment)max) - this margins command provides specific predicted values of y at different values of x
Margins, dydx (variable) - this margins command provides different coefficients at different levels of x - the effect of x on y at different levels of x
400
What is the formula for Bayes Theorem?
Pr 𝐴|𝐵 = Pr(𝐵|𝐴)∗Pr(𝐴) / Pr(𝐵)
400
How do you find the critical values for a confidence interval? Hint: two different answers for a population vs sample
•Population standard deviation: use the z-table
•Sample standard deviation: use the t-distribution
Degrees of freedom = n-1 or (n1+n2)-2
400
Write a formula for a regression with controls on the board and what phrase do you add to your interpretation of a regression coefficient with controls?
y= Bo + B1x + B2w + B3z +... + E
Holding all else constant
400
How do I interpret a log-log equation?
In log log, the beta one remains the same, but both variables turn into percents
(i.e. a 1% change in x results in a B1% change in y)
**remember to look at the cheat sheet on Busby's slides
400
What is the code for an interaction?
reg y-var c.x-var##i.z-var control variables, r
i. = binary
c. = continous
500
Construct a probability tree for the following scenario:
Jimothy flips a coin three times. He has a 40% chance of flipping heads and a 60% chance of flipping tails. What is the probability that he will flip heads only once?
You did it!
500
When do you reject the null hypothesis when using a confidence interval?
When the confidence intervals do not overlap
500
Interpret 3 things in this Stata output:
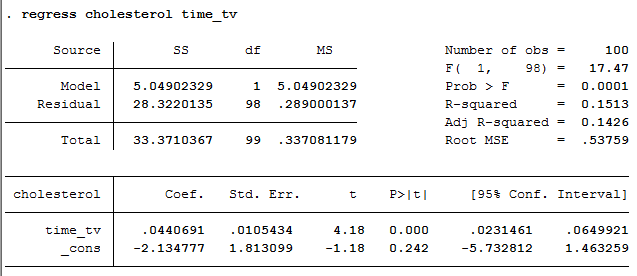
You did it!
500
Interpret the following equation in an interaction model:
Health= 3.7 + 1.2 (medicine) + 5 (grapefruit) - 57000 (medicine * grapefruit)
(interpret all 4 numbers)
3.7 is the expected health score of someone who does not take medicine or eat any grapefruits
When a person eats 0 grapefruits a week, taking medicine increases their health score by 1.2 points
When a person does not take medicine, each additional grapefruit they eat increases their health score by 5 points
When a person does take medicine, each additional grapefruit decreases their health score by an additional 57000 points (added to 5* number of grapefruits)
500
What code do I use to make a line graph with pov as the y-variable, totpop as the x variable, in which you create lines for different counties - code is below
Hint: requires a code before the line graph code
collapse pov, by(county totpop)
twoway line pov totpop if county == "Utah" || line pov totpop if county == "Weber" || line pov totpop if county == "Davis"
Rule: collapse your y-variable by the x-variable and the variable you would like to create lines for.