Comparing Functions
Histograms
Statistics
Exponentials
Mystery Box
100
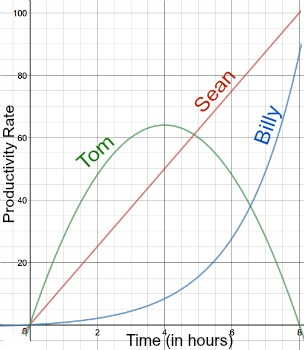
Who shows linear growth
Sean
100
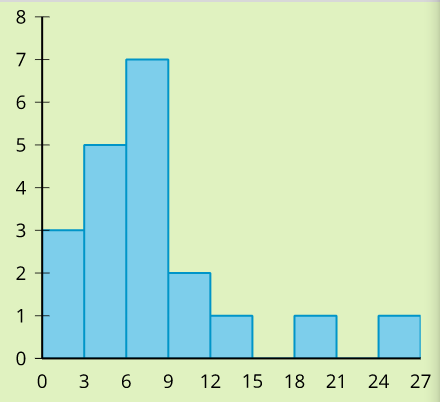
Describe the skew:
Skewed Right
100
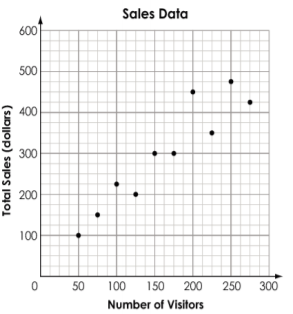
What is the most visitors that the store had?
270
100
y = (12.5) (1.30)x
What is the percent being gained?
30%
100
How old is Mr. Miller?
23 (you get credit if u guessed 22 or 24)
200
Who has increasing and decreasing intervals
Tom
200
Should we use mean or median to describe the data?
Median bc there is outliers
200
Describe what the slope of this graph is telling you
As the number of visitors increases, the revenue will also increase
200
y = (12.2) (0.9) x
What is the percent being lost?
10%
200
Duluth GA was named after a city with the same name but in a different state.
What state is that?
Minnesota
300
As time goes on forever, Who will be the most productive?
Billy
300
How many people scored between a 12 and a 23
2
300

Describe this correlation in 2 ways
Positive and Strong
300

A. loses 13%
300
20, 60, 180, 540
What is the common ratio
3
400
Who has the largest f(4) value?
Tom
400
How many people scored less than a 9?
15
400
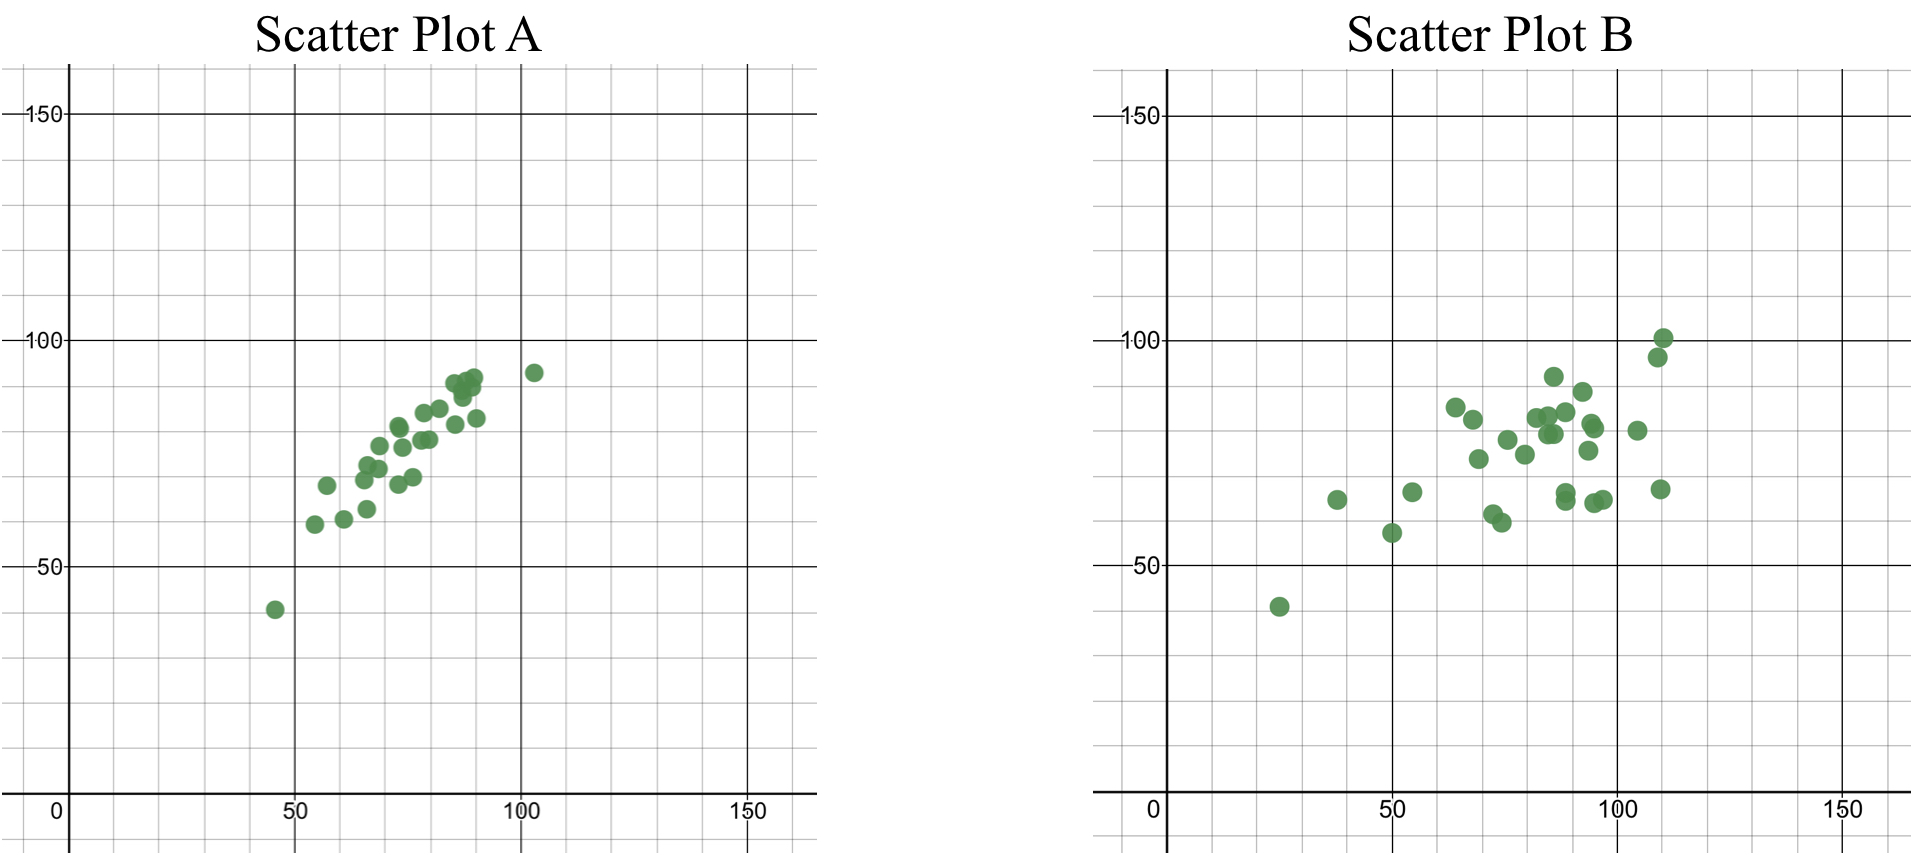
On plot B, f(?) = 75. What is ? equal to
75ish
400
Population doubles every 6 hours.
It starts at 3.
What will population be after 1 day
48
400
22, 18, 14, 10
Linear, Quadratic, or Exponential
Linear
500
Between what hours does Sean become more productive than Tom?
Between hour 4 and 5
500
Should we use standard deviation or IQR to describe the data?
IQR because there is outliers
500
On plot A, what would you expect the value of f(150) to equal?
125
500
Population growing by 12.2% every 2 months.
Starts at 2000.
What is population after a year
2148 or so
500
8, 12, 18
What is the 5th number?
40.5