Mean
Median & Range
Mode
Stem and Leaf Plot
Box Plots
100
find the mean in this data.
216, 230, 198, 252
226 = mean
100
find the median.
7, 5, 2, 2, 6
median = 5
100
what is the mode?
16, 18 ,18
mode = 18
100
organize and put in a stem and leaf plot. 70, 80, 90
7 l 0 8 l 0 9 l 0
100
What is the interquartile range in this box and whisker plot?

40
200
find the outlier in this data.
28, 26, 30, 24, 70
70 = outlier
200
what is median and range of -
10, 5, 7, 7, 3
answer = 6
200
what is the mode?
PEN, PEN, CRAYON, MARKER, PEN, MARKER
PEN = mode
200
make a key for the stem and leaf plot.
78, 54, 28
2 l 8
5 l 4 key = 5 l 4 = 54
7 l 8
200
What is the lower quartile in this box and whisker plot?
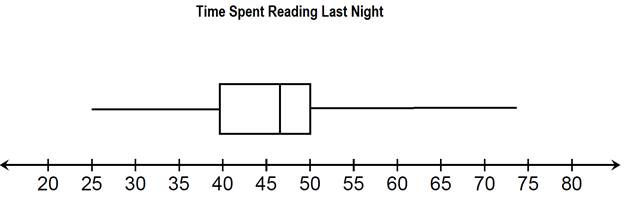
40
300
find the mean of students per year.
22, 5, 20,25, 23
19 = mean
300
find the median in this set of data.
26, 80, 5, 1, 2, 60, 0
answer = 5
300
make a table to orginaze the data.
17, 17, 6, 18, 2, 18, 7, 8
answer may vary.
300
put in a stem and leaf plot.
16, 14, 28, 90, 38, 18, 26, 93
1 l 4 6 8
2 l 6 8
3 l 8
9 l 0 3
300
What percent of student scored below 70?
75%
400
give the steps of how to find the mean.
#1- add all the numbers together.
#2- take the answer from #1 and divide it by the number of data peices you have.
#3- after all that you will get your answer.
400
find the median and range.
8, 6, 0 , 0, 6, 8, 5, 20
answer = 5
400
mode = __?
100, 45, 60, 11, 16, 20, 88
answer = no mode
400
draw and find the median in this stem and leaf plot.
24, 67, 80, 61, 10, 20, 90
answer = 61
400
Draw a box plot representing the data
25, 40, 45, 47, 48, 50, 75
500
mean = 32.5
find the missing data piece in the mean
60, 20, __, 60, 5, 40
the missing data piece = 10
500
Julia has 8 cookies, Amber has 3 cookies, evelina has 20 cookies and Haley has 10 cookies. What is the median and range in this data?
answer = 9
500
if you were finding the mode in decimals, would you use the same method?
answer + yes
500
find the median and mode in this stem and leaf plot
16, 18, 26, 89, 24, 18, 24, 16
1 l 6 6 8 8
2 l 4 4 6
8 l 9
median = 21
mode = 16, 18, 24
500
Draw a box and whisker plot using the following data set:
85, 78, 98, 69, 94, 90, 80
